Pyplan Data Analyst I – Module 2
Interfaces: What They Are, How to Manage and Create Them, and How to Use Indexes, Inputs, and the Analyst Agent
In this module we focus on the user‑facing side of a Pyplan application: interfaces. We work step by step through:
- What interfaces are and how to manage them with the Interface Manager.
- How to create an interface and add components.
- Basic component configuration and visualization options.
- How indexes work in interfaces, including hierarchies and synchronization.
- How to create simple manual data inputs.
- How to use the Analyst Agent, including how it uses context from the current interface.
1. What Interfaces Are in Pyplan
An interface is a screen or dashboard where users:
- See results (tables, charts, indicators, reports).
- Filter and explore data (index selectors, filters, menus).
- Input data (forms, scalar inputs, upload managers).
- Trigger actions (buttons, processes, scheduled tasks).
Technically, an interface:
- Is linked to one application version.
- Is built from components (widgets) placed in a grid.
- Reads and writes data through nodes in the influence diagram.
2. Interface Manager: Viewing and Organizing Interfaces
The Interface Manager is where we:
- See all interfaces in the current app.
- Open, edit, duplicate, export, or delete interfaces.
- Manage documentation, permissions, and links.
2.1 Opening the Interface Manager
Step‑by‑step
- Open a Pyplan application (in this case, Data Analytics Demo).
- In the main menu, click Interfaces.
- The Interface Manager appears with a list of existing interfaces.
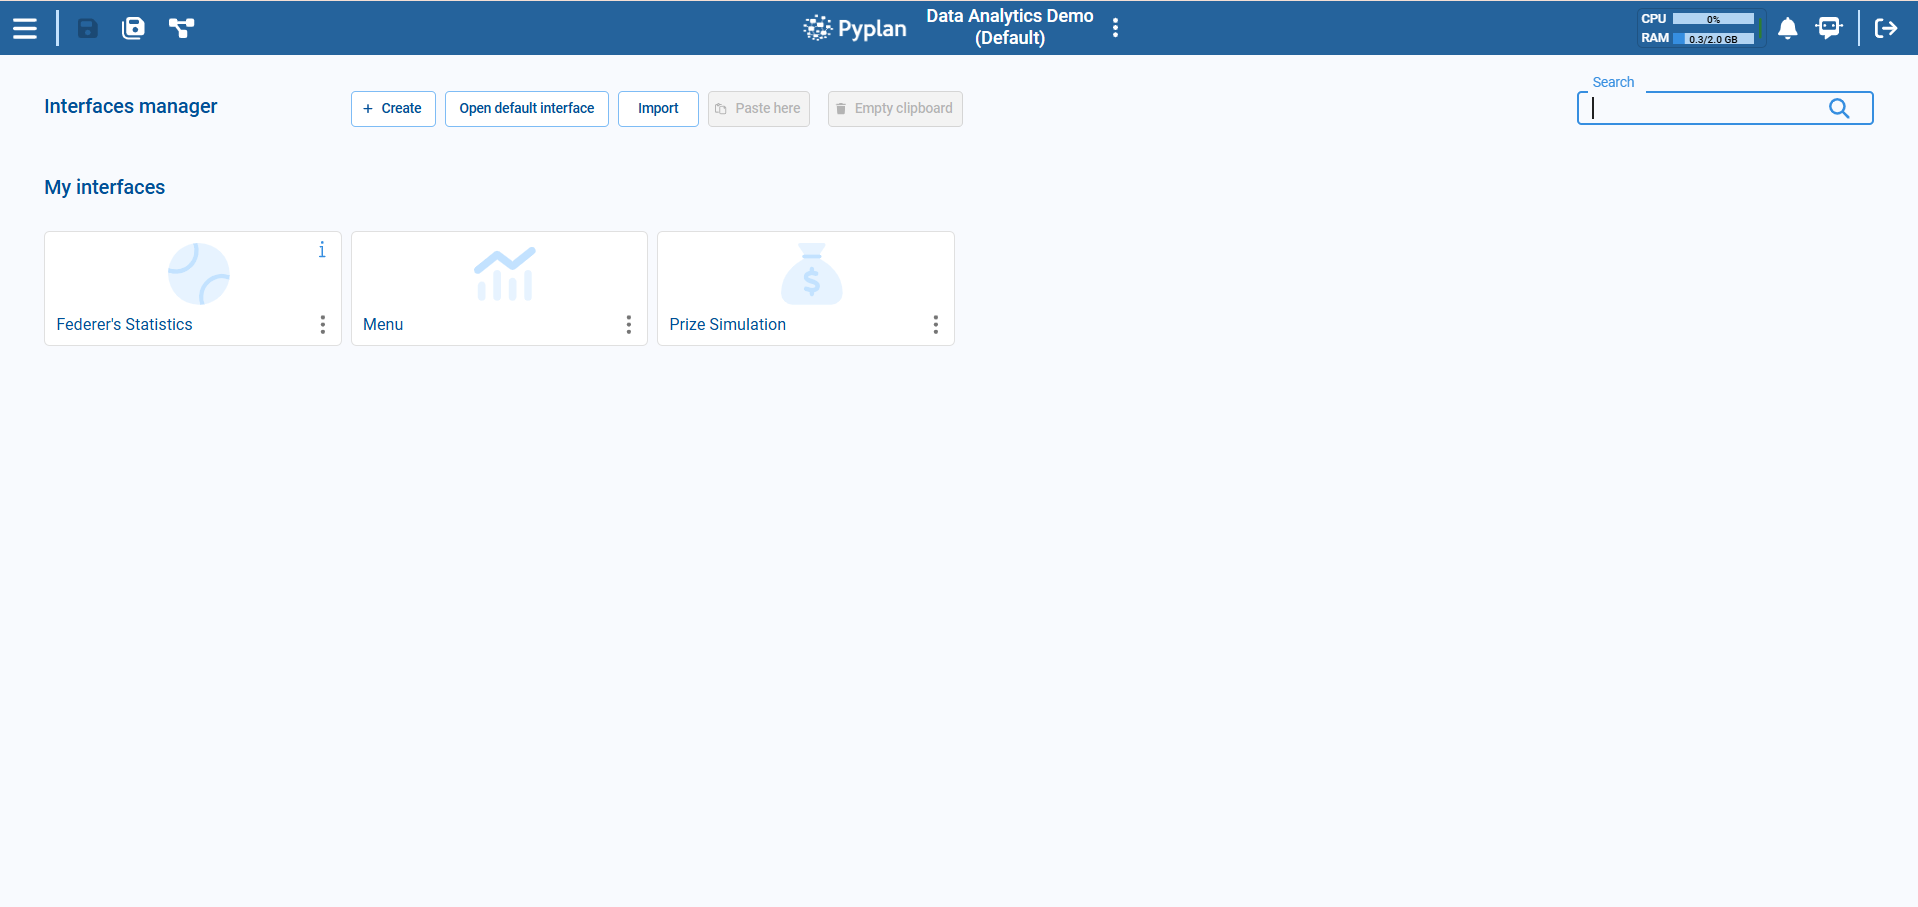
Each row in the Interface Manager shows an interface with options in its context menu.
2.2 Key Actions in the Interface Manager
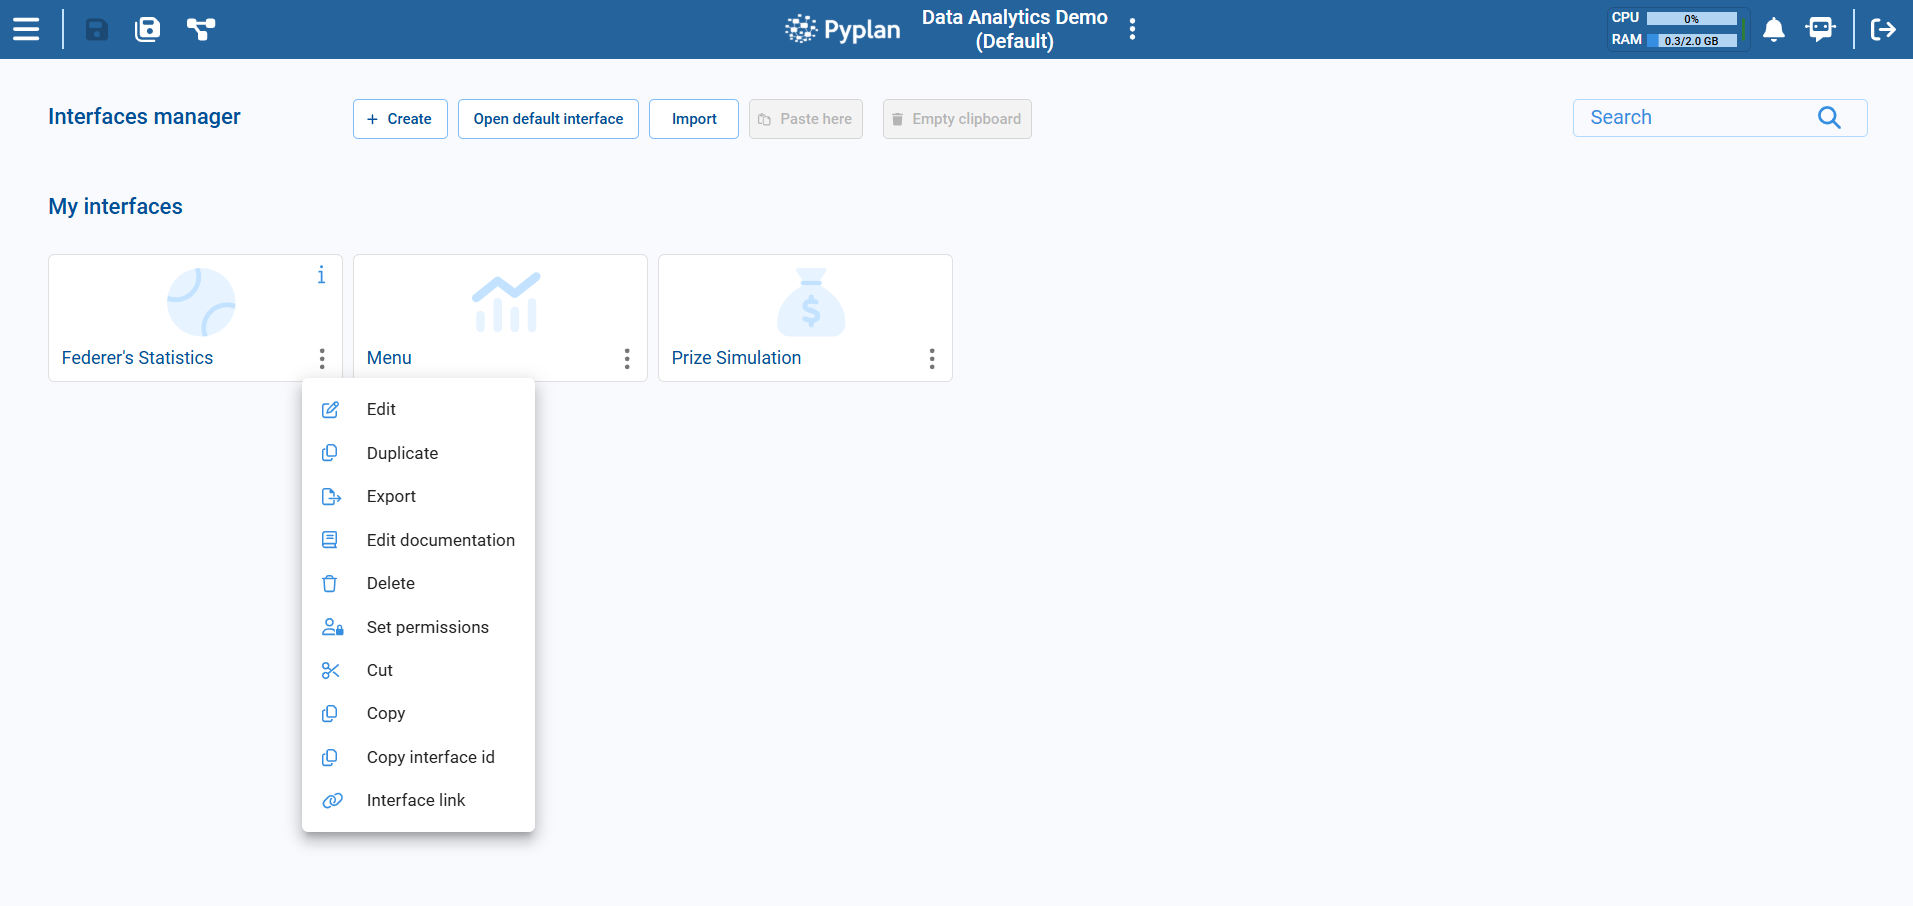
From the context menu of an interface we can:
- Edit – open in design (edit) mode.
- Duplicate – create a copy (useful for variations).
- Export – download the interface definition.
- Add/Edit Documentation – attach explanatory text.
- Delete – remove the interface.
- Set Permissions – control which departments can access it.
- Copy Interface ID – copy the unique id (useful for links and advanced config).
- Interface Link – manage public links to that interface.
3. Creating a New Interface
We now create a simple interface from scratch.
3.1 Create an Interface
Step‑by‑step
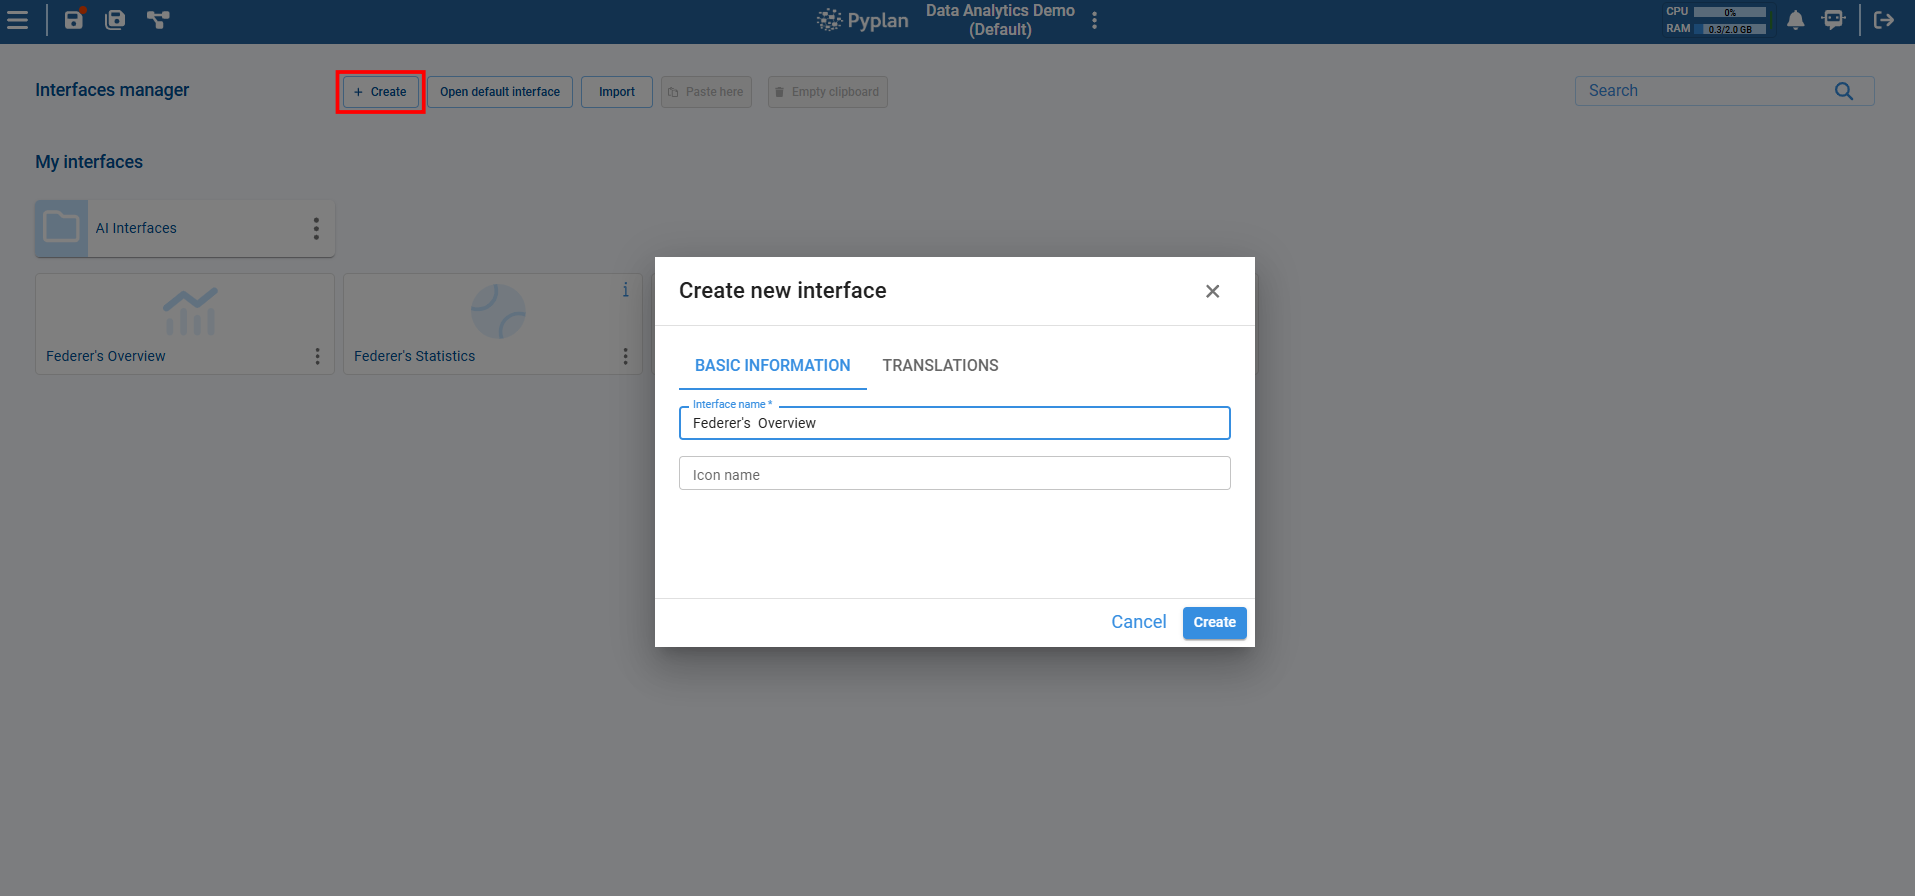
- In Interface Manager, click Create (usually top‑left) and select New Interface.
- In the dialog:
- Enter a Name, e.g.
Federer's Overview. - (Optional) Select an icon that represents the interface.
- Enter a Name, e.g.
- Confirm to create it.
Pyplan creates a new, empty interface and opens it.
3.2 Enter Edit Mode
By default, the interface opens in Edit Mode. If it does not:
- In the interface's top‑right corner, click the Edit icon.
- The editing grid and component toolbox appear.
We are now ready to add components.
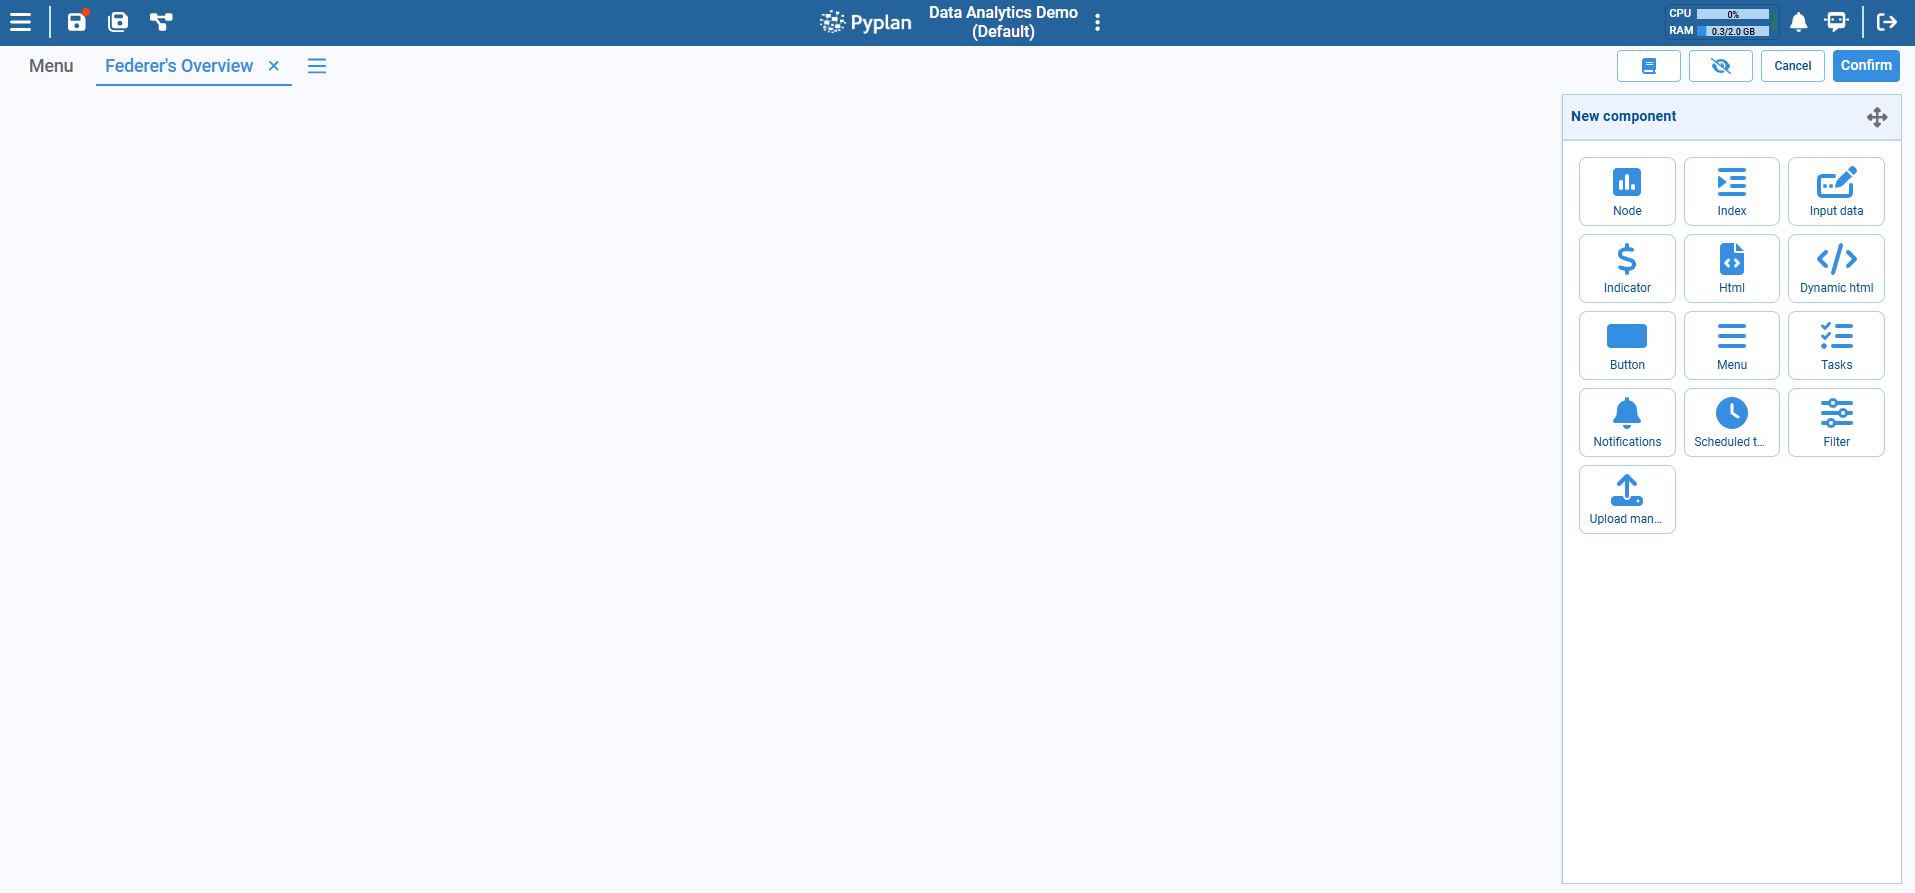
4. Adding Components to an Interface
Components (widgets) are the building blocks of interfaces. We drag them from the toolbox to the grid.
4.1 Types of Components (Overview)
Common component categories:
- Data display
- Table (node result)
- Chart / Graph
- Indicator (single KPI)
- HTML / HTML Dynamic
- Filtering and navigation
- Index component
- Filter component
- Menu component
- Input and actions
- Input Data component (scalar input)
- Forms, Cubes (through nodes + table components)
- Button
- Upload manager
- Process and monitoring
- Tasks, Notifications, Scheduled tasks
In this module we focus on:
- Basic data components (tables, charts, indicators).
- Filters based on indexes.
- Simple manual input.
- Analyst Agent.
4.2 Adding a Basic Table Component
- In Edit mode, go to the New Component panel (toolbox).
- Drag a Node component onto the grid.
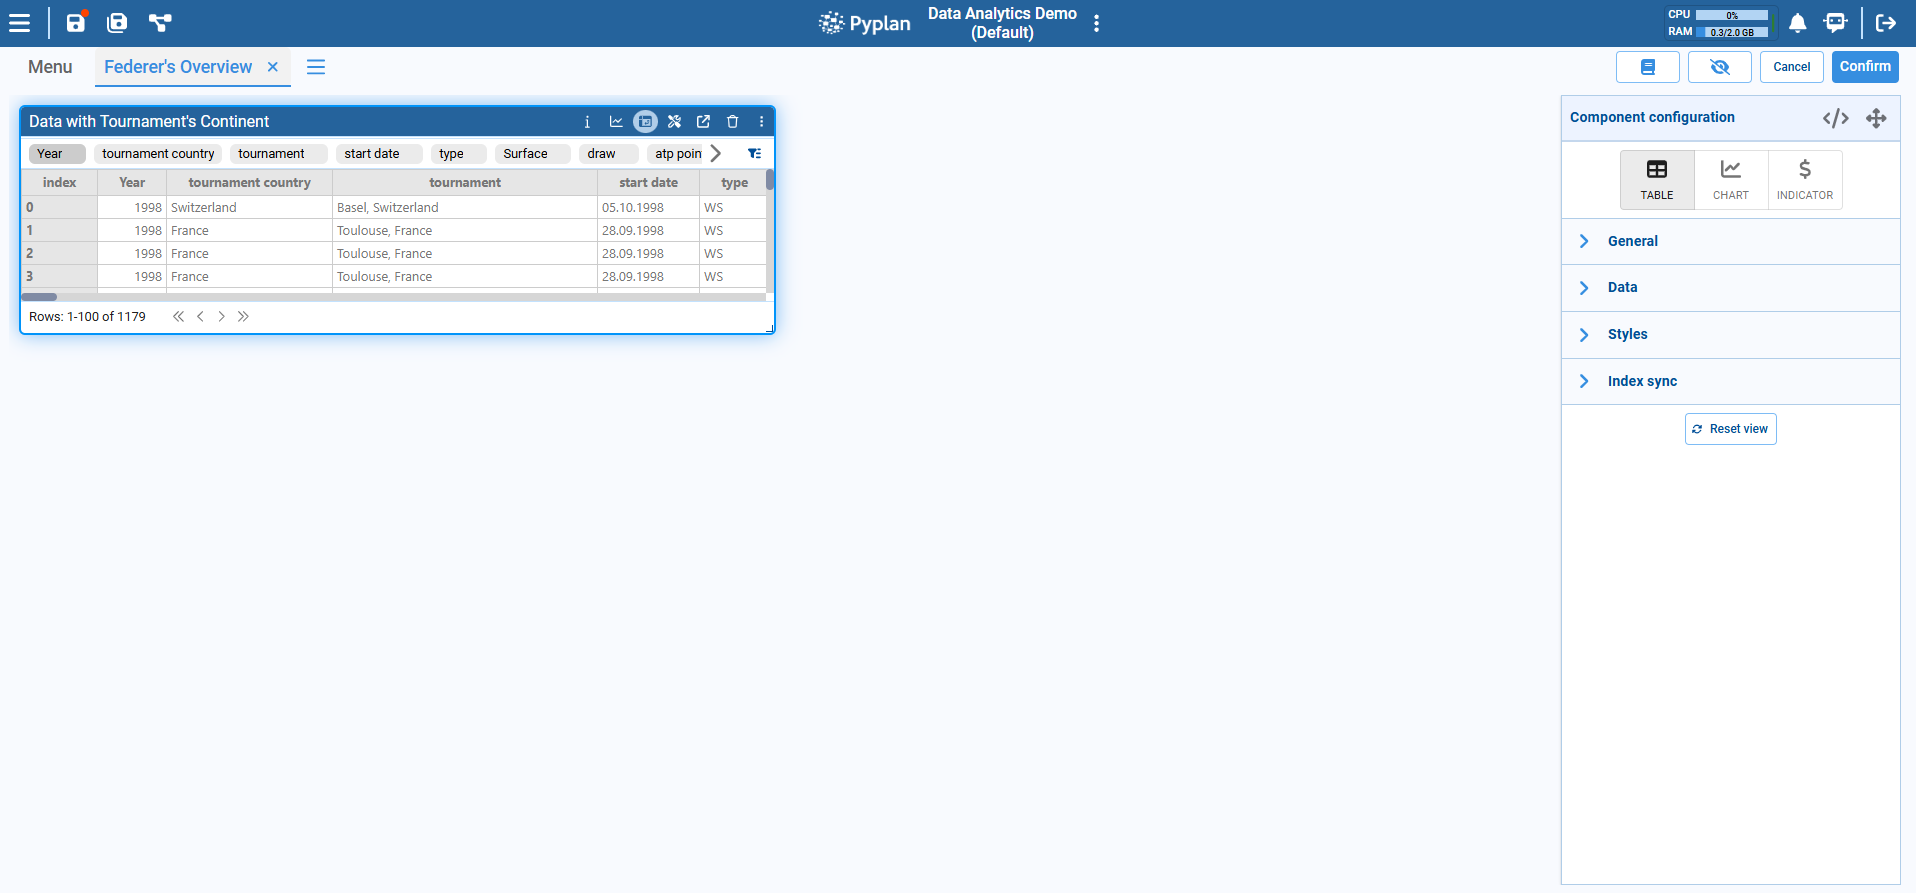
- After dragging, a diagram opens. Select the node that contains a table result (in this case select the Data with Tournament's Continent).
- With the node selected, open the Component Configuration panel. Under General, adjust the title if necessary.
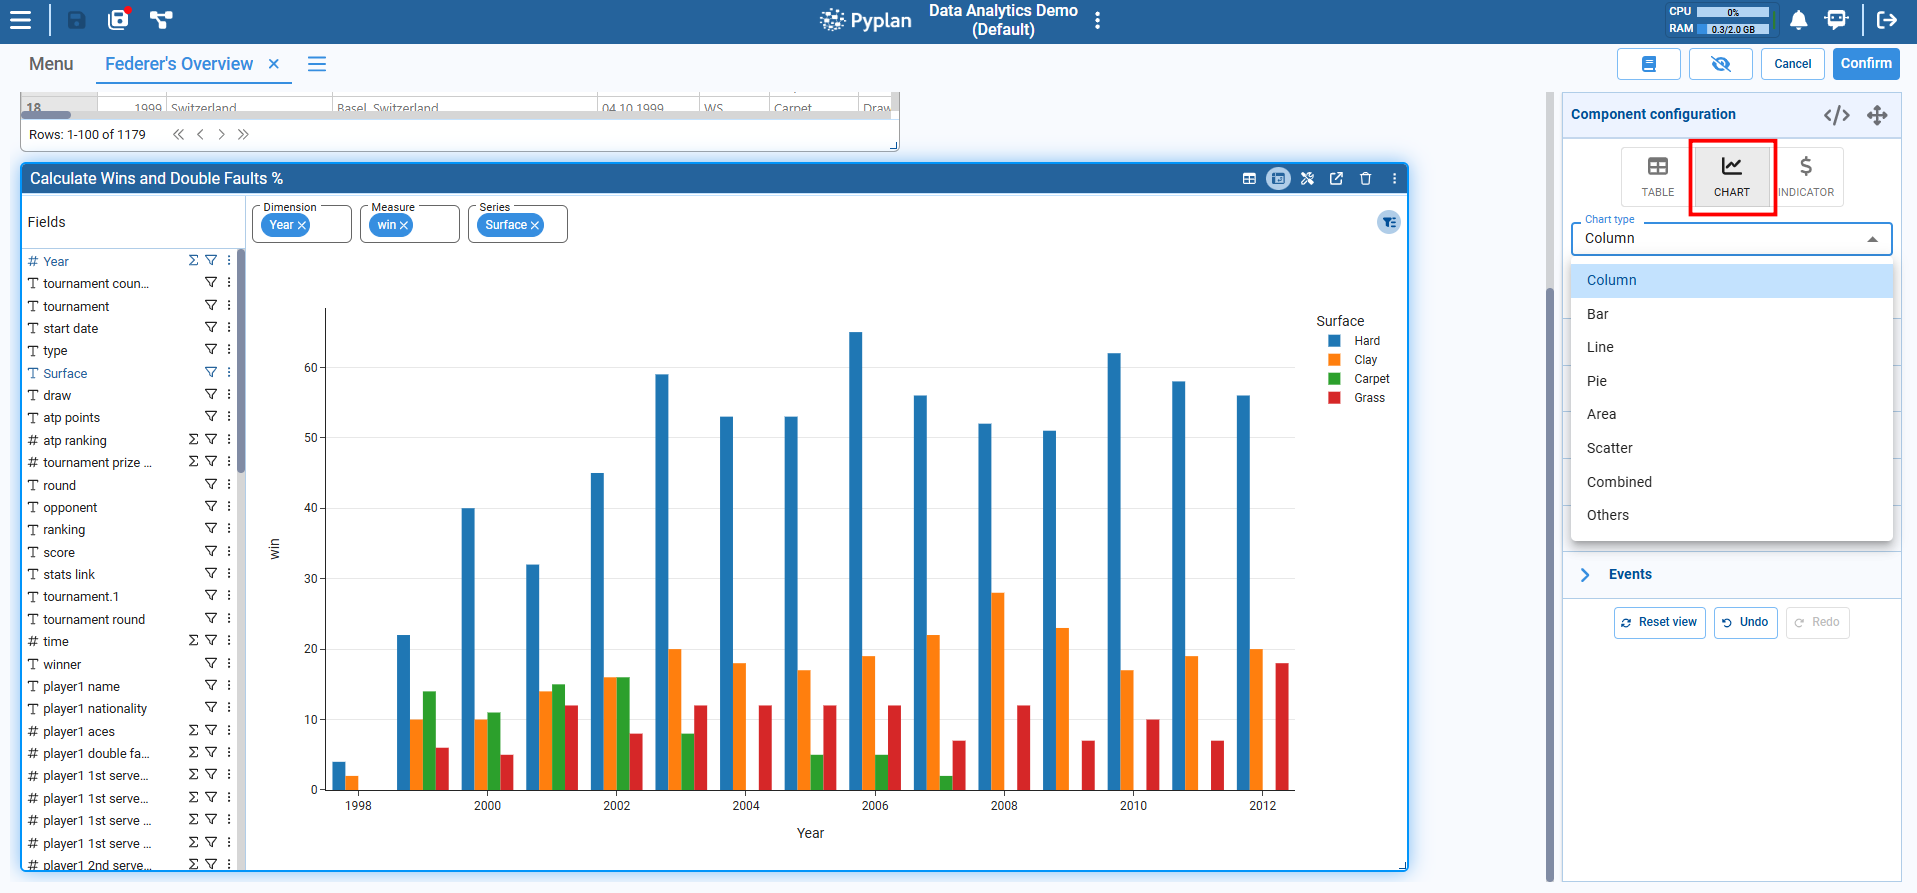
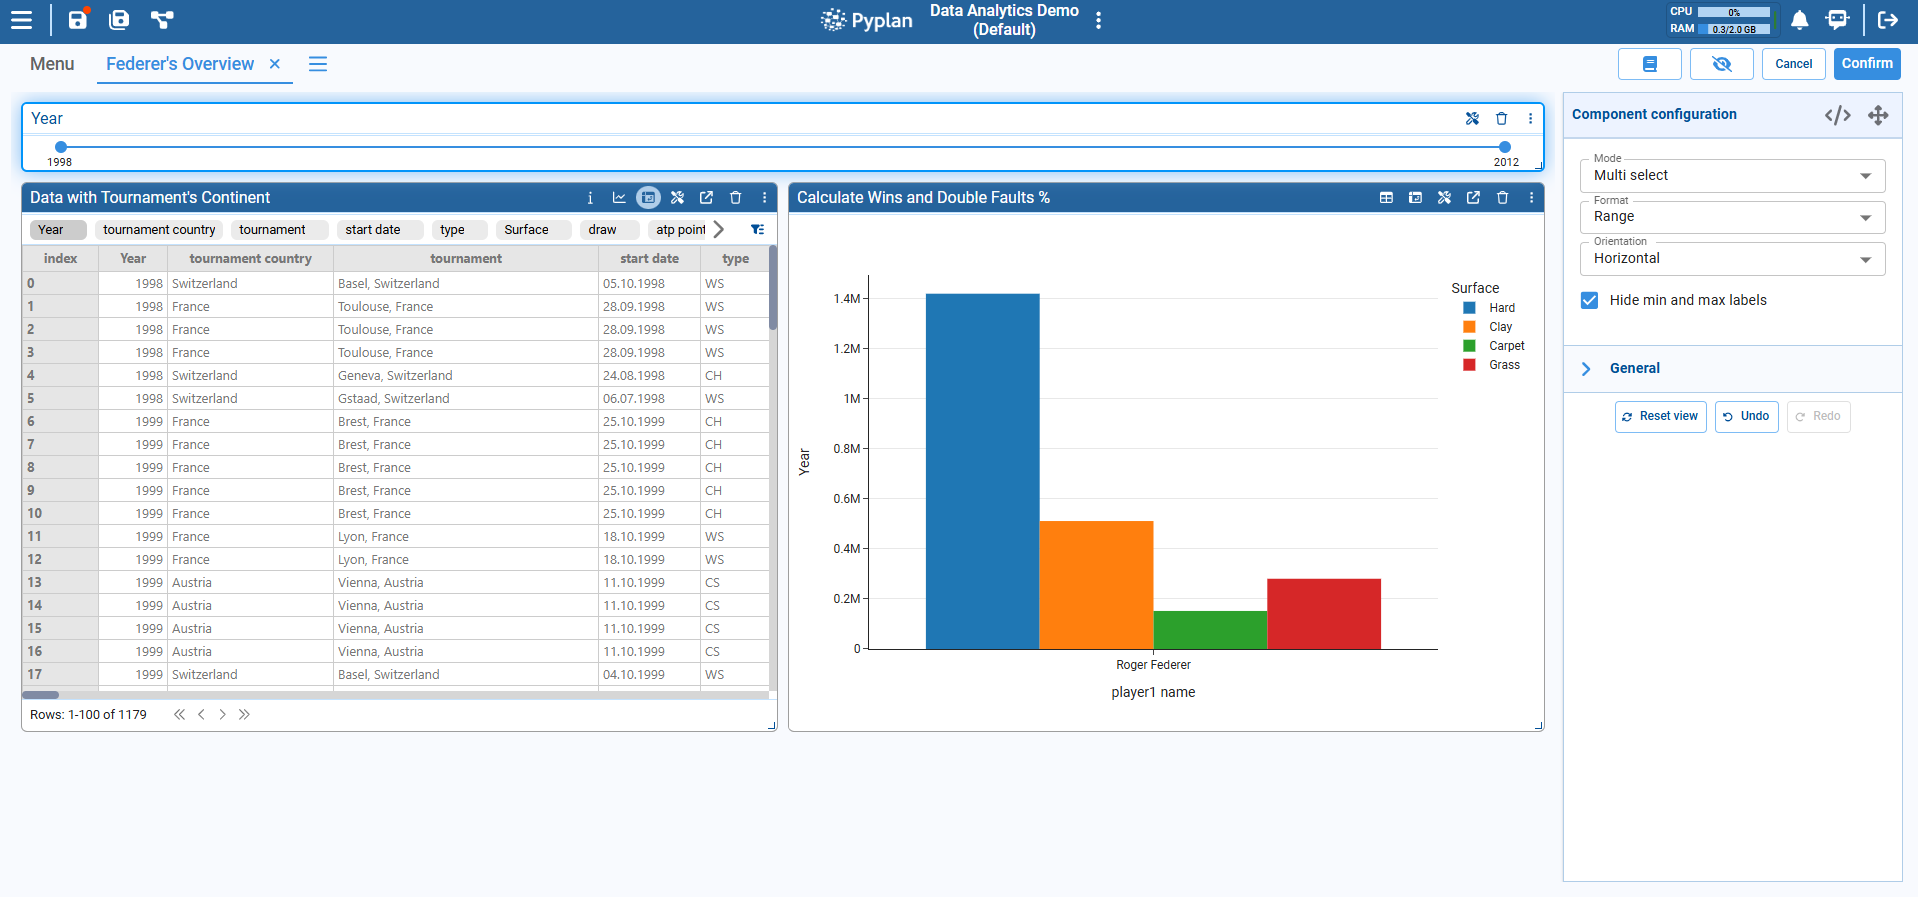
4.3 Adding a Basic Chart Component
- In Edit mode, open the New Component panel toolbox (if a component is selected, press ESC or click outside the component to return to the "New Component" panel).
- Drag a Node component onto the grid.
- After dragging, a diagram opens. Select the node Calculate wins and Double Faluts %.
- In the Component Configuration panel:
- Select a Chart Type (for example, Column, Bar, or Line).
- Configure the axes and measures as follows (to pivot the chart, we can use the advanced pivot function):
- Dimension:
Year - Measure:
Win - Series:
Surface
- Dimension:
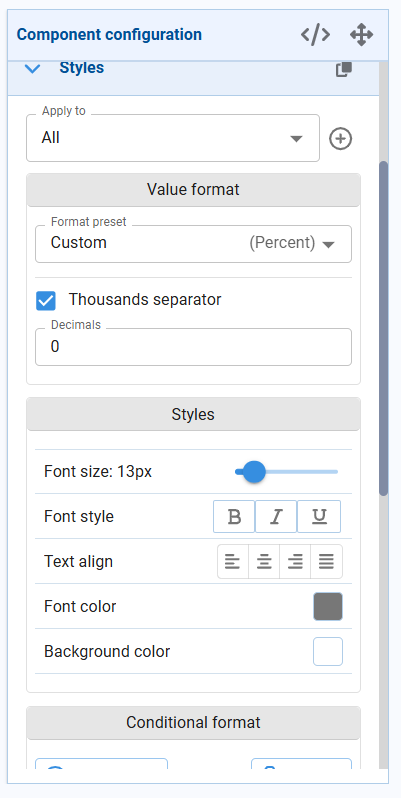
4.4 Adjusting Visualization: Styles and Formats
Most visual components share similar configuration sections, especially Styles:
- Value format – Number, Percentage, Currency, etc.
- Font size and font style – Emphasize key data.
- Text alignment – Left, center, right.
- Colors – Font color and background color.
- Conditional formatting (for tables and indicators) – Change style based on value.
- Heatmap / Progress bar – For tables, to highlight magnitude.
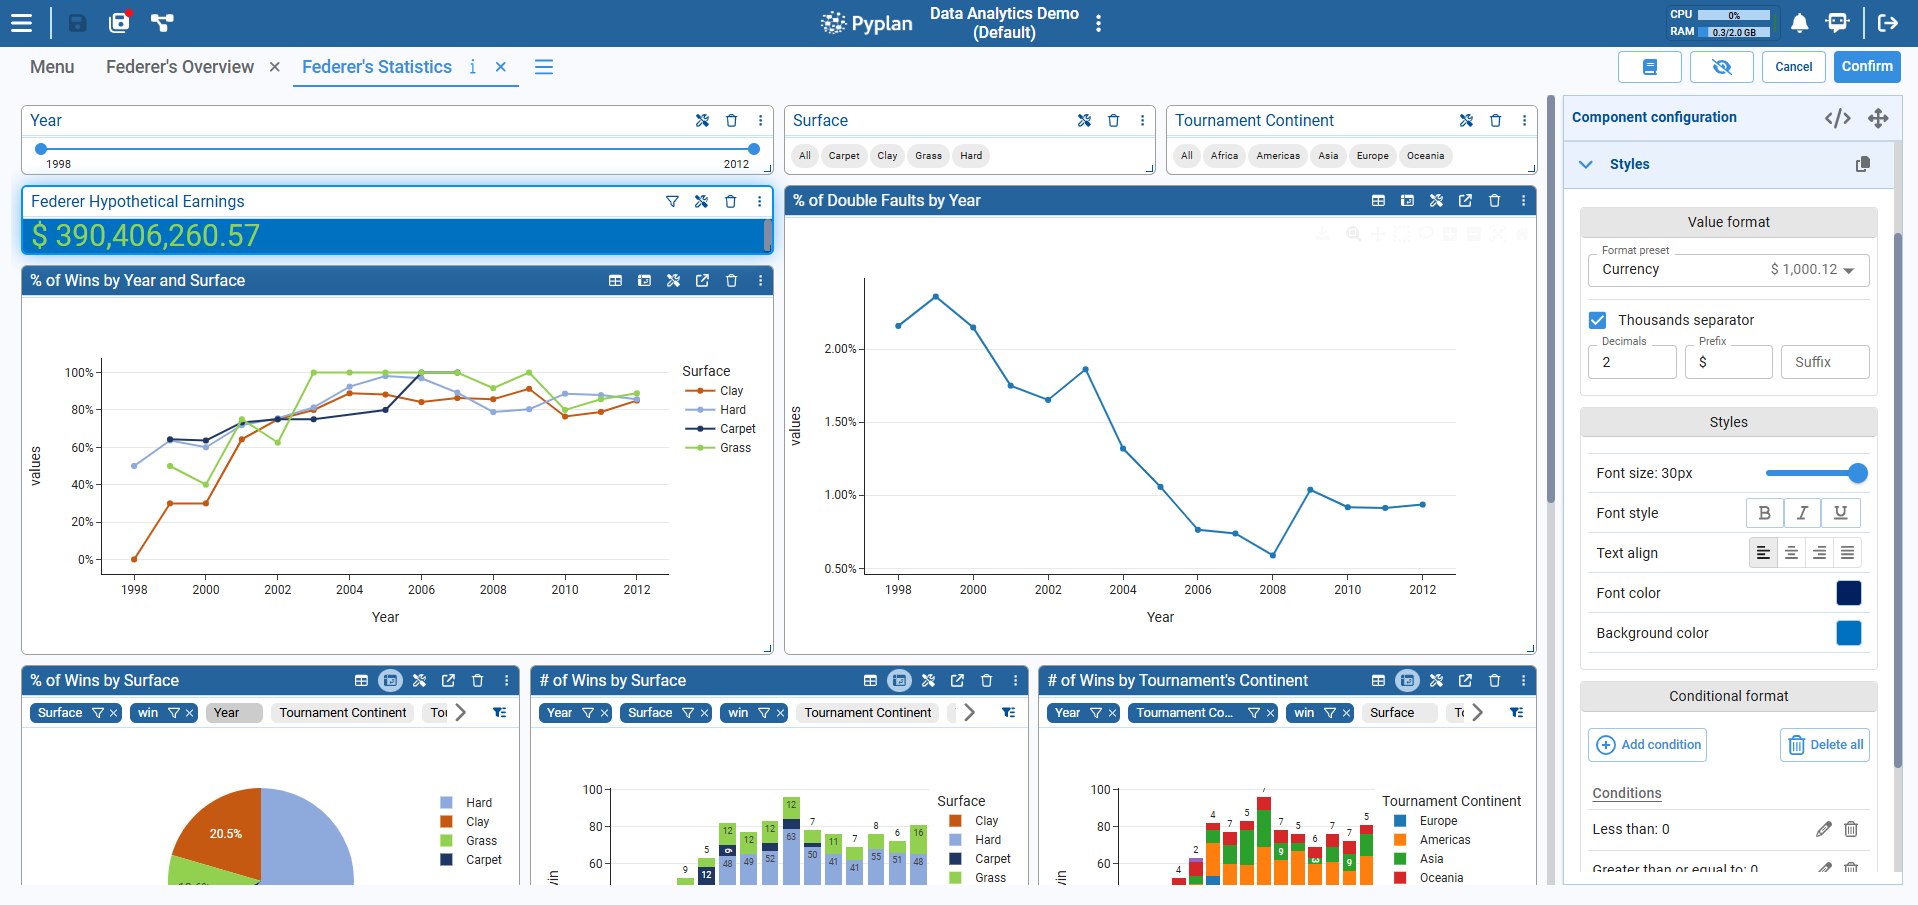
Example: adjust a KPI Indicator
- Add an Indicator component.
- Select a node that returns a scalar (or a slice of a cube). Select the node Federer Hypothetical Earnings.
- In Styles:
- Set Value format to Currency.
- Increase Font size to 30 px.
- Set a blue background color.
- Optionally add Conditional format:
- If value < 0 → red text.
- If value > 0 → green text.
5. Indexes in Interfaces: Filtering, Hierarchies, and Synchronization
Indexes define dimensions like Product, Region, Year, etc. In interfaces, they drive filters and slicing of tables and charts.
5.1 Index Nodes and the Index Component
In the model:
- An Index node holds a list of elements (
pandas.Index). - Many tables and cubes use those indexes as dimensions.
In the interface:
- The Index component lets users select one or more values from an index:
- Single select
- Multi select
- Different display formats (tags, range, dropdown, options list, slider)
Step‑by‑step: add an Index component
- In edit mode, drag an Index component to the top of the interface.
- In the configuration panel:
- Select the Index node (e.g.,
Year). - Choose Mode: Single select or Multi select.
- Choose Format: Default tags, Select (dropdown), Range slider, Options list, etc.
- Select the Index node (e.g.,
- Optionally adjust Orientation (horizontal or vertical).
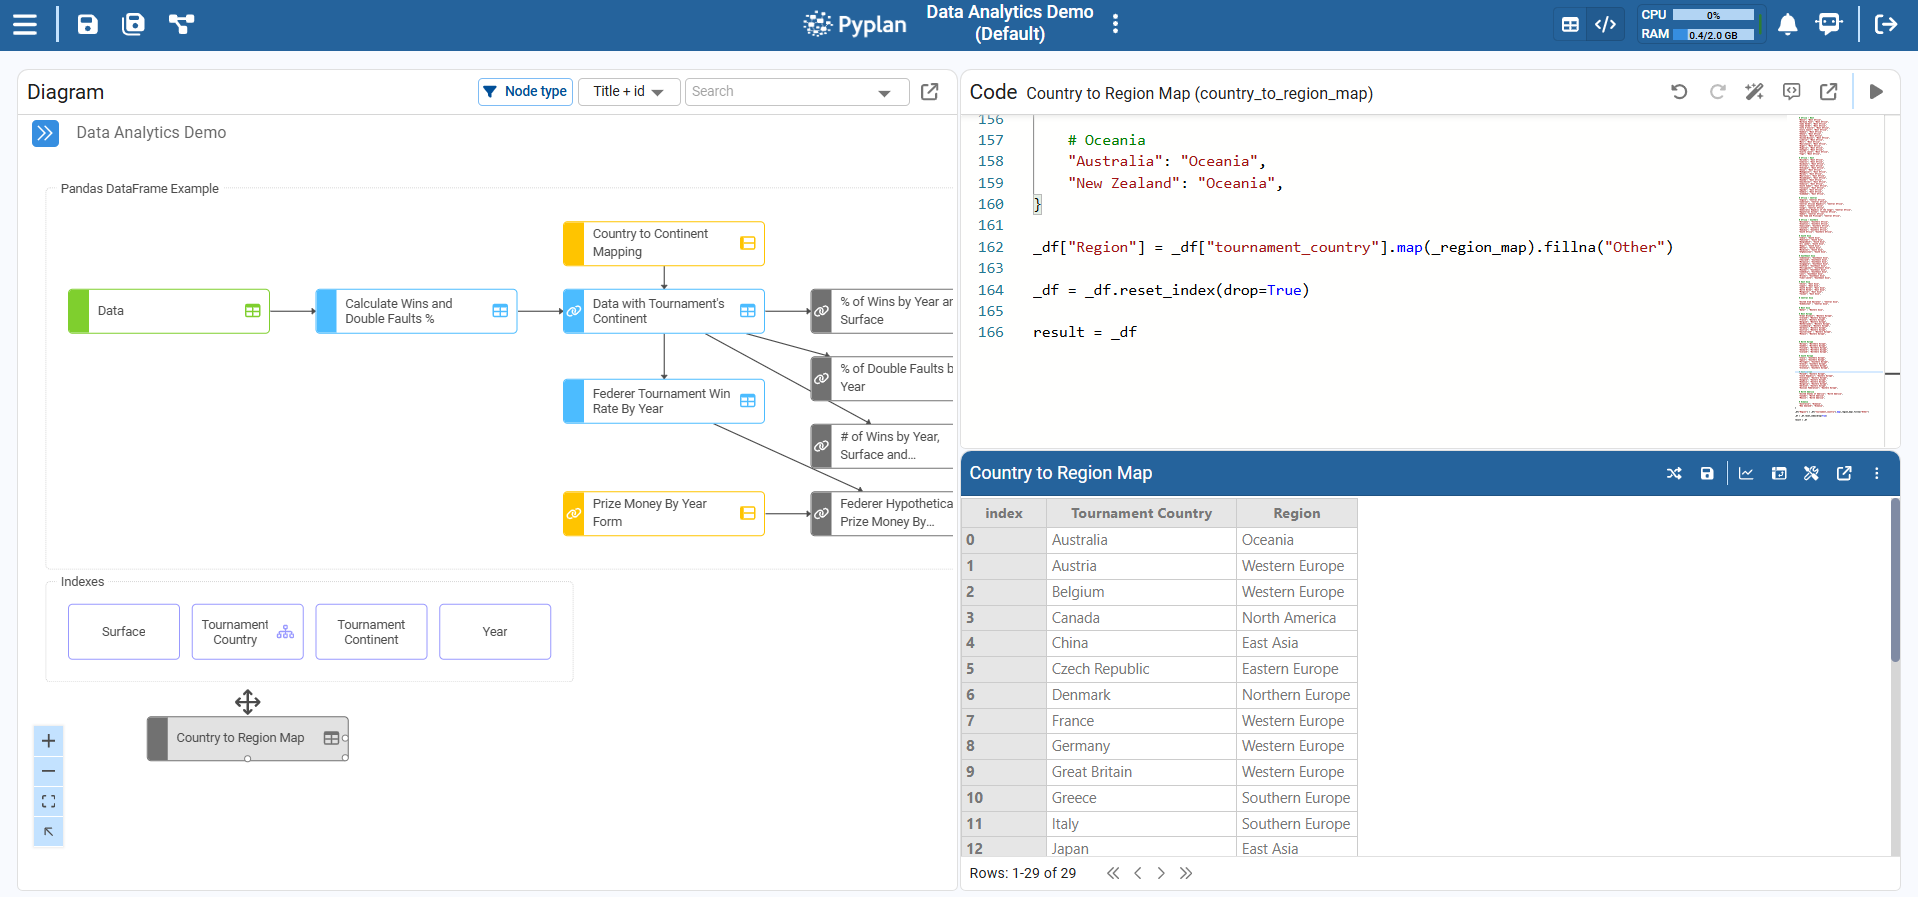
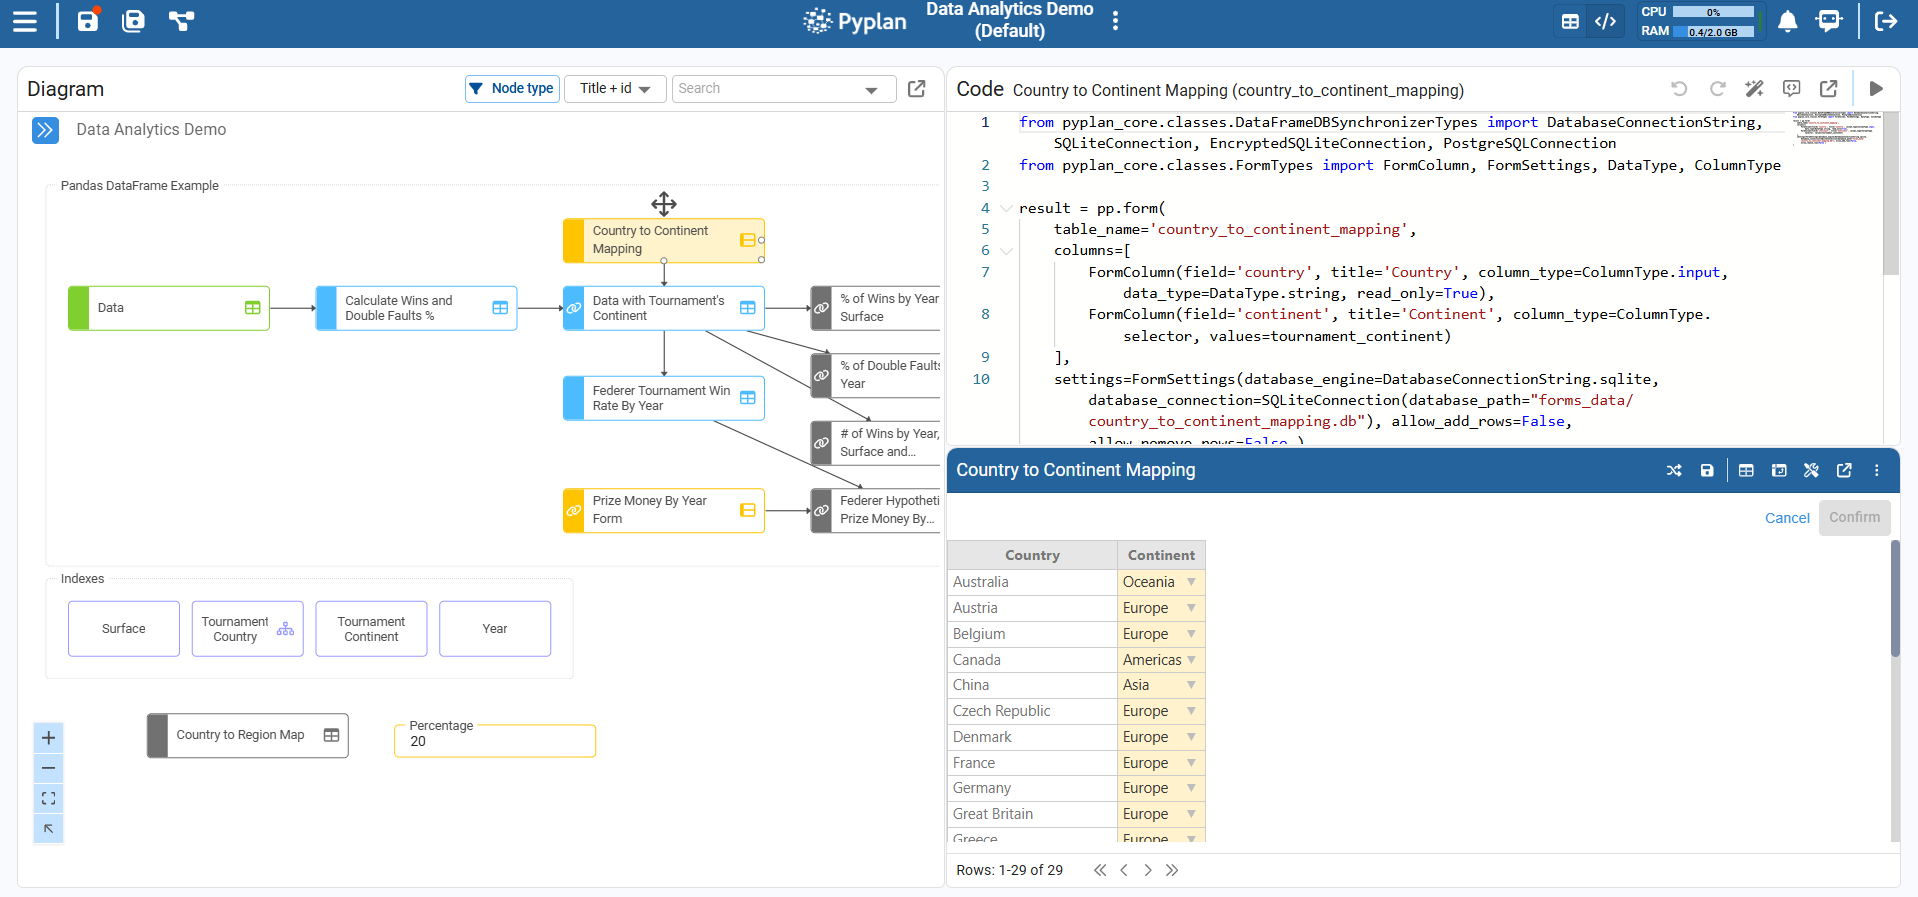
5.2 Hierarchies in Indexes
In the model, an index can have a hierarchy, e.g.:
- Country → Region → Continent
- Month → Quarter → Year
This is defined via a mapping table in the index properties. In the diagram, hierarchical indexes are marked with a special icon.
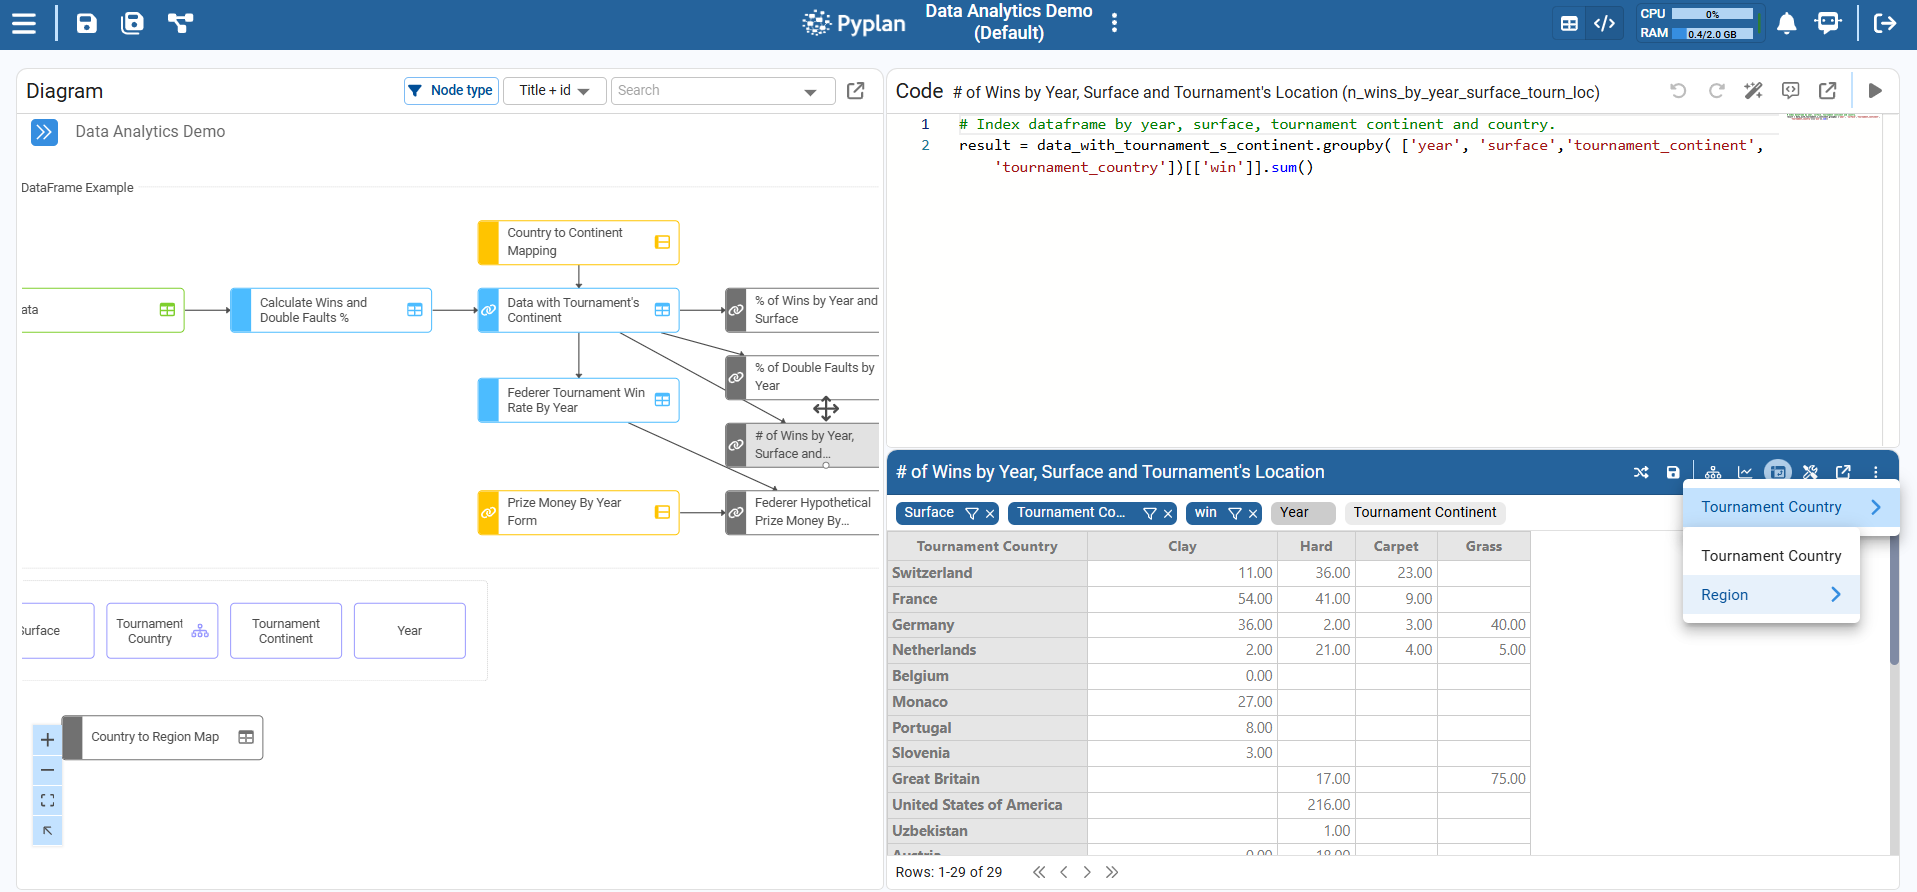
In interfaces, hierarchies allow us to:
- Filter by a higher‑level index (e.g. Continent) and see data aggregated or filtered at that level.
- Drill down into lower levels (e.g. from Continent to Country).
Typical pattern
- One interface has:
- An Index component for a higher‑level index (e.g., Continent).
- Another Index component for a lower‑level index (e.g., Country), often dependent on the first.
- The underlying cubes or tables aggregate along these dimensions.
5.3 Index Synchronization (Index Sync)
Index synchronization ensures that:
- When we change a selection in one Index component, related components update consistently.
- Tables and charts that share the same index dimension reflect the same filter.
In tables and charts we can configure Index sync:
- Which index dimensions should be synchronized.
- Whether a component listens to global index selection or not.
Step‑by‑step: sync a table with an Index
- Add an Index component for, say,
Year. - Add a Table component bound to a node that has
Yearas an index. In this case, add the node: % of Wins by Year and Surface. - With the table selected, open the configuration panel.
- Go to the Index sync tab.
- Ensure the
Yearindex is checked or associated with the interface‑level filter. - Exit edit mode.
- Change the selected year in the Index component → the table updates automatically.
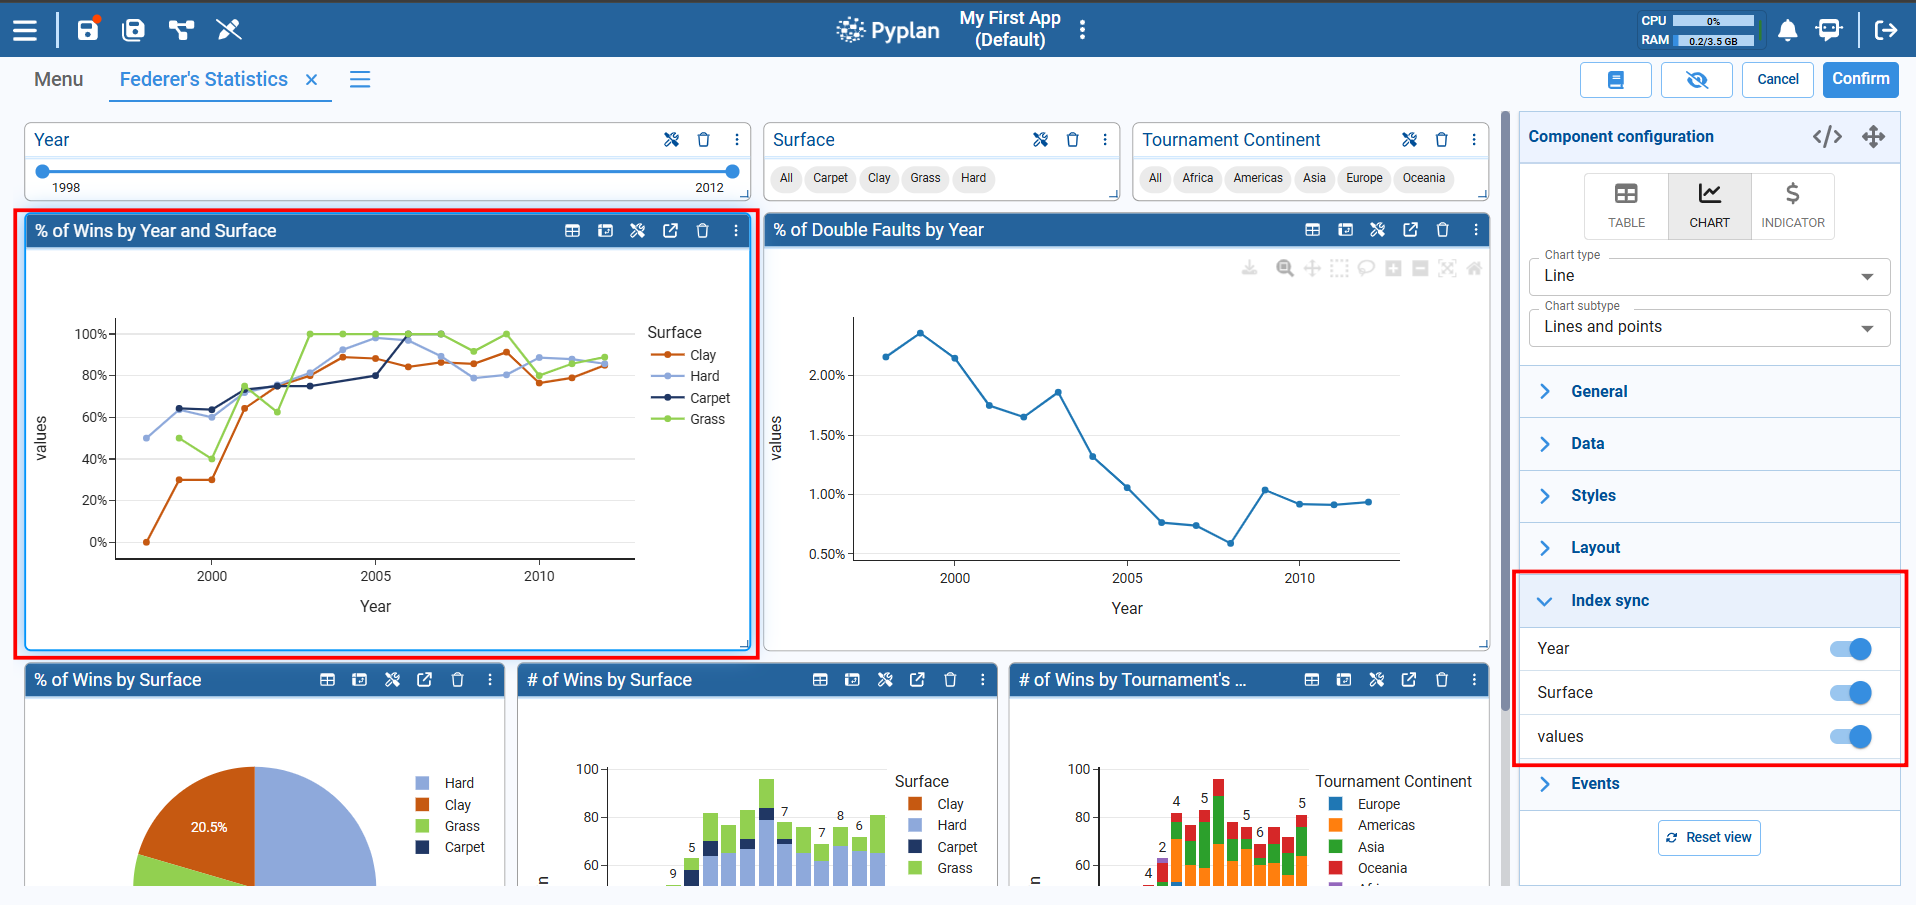
When multiple components share the same indexes and sync configuration, they all respond together to the same filter selections.
6. Simple Manual Data Entry
We now focus on simple manual inputs inside interfaces, where users can type or modify values directly.
6.1 Scalar Input
For single values (rates, thresholds, flags, etc.), we use the Input Data component linked to a node that represents an input.
Step‑by‑step: add a simple numeric input
- Go to code and create a new Input Scalar Node.
- Add it as an Input Data component to the interface.
- In General: Set a Title, e.g.
Percentage. - In Validations:
- Data type →
Float. - Rule →
Range, e.g. min 0, max 100 (for 0–100%).
- Data type →
- In Styles: Adjust font size and alignment if needed.
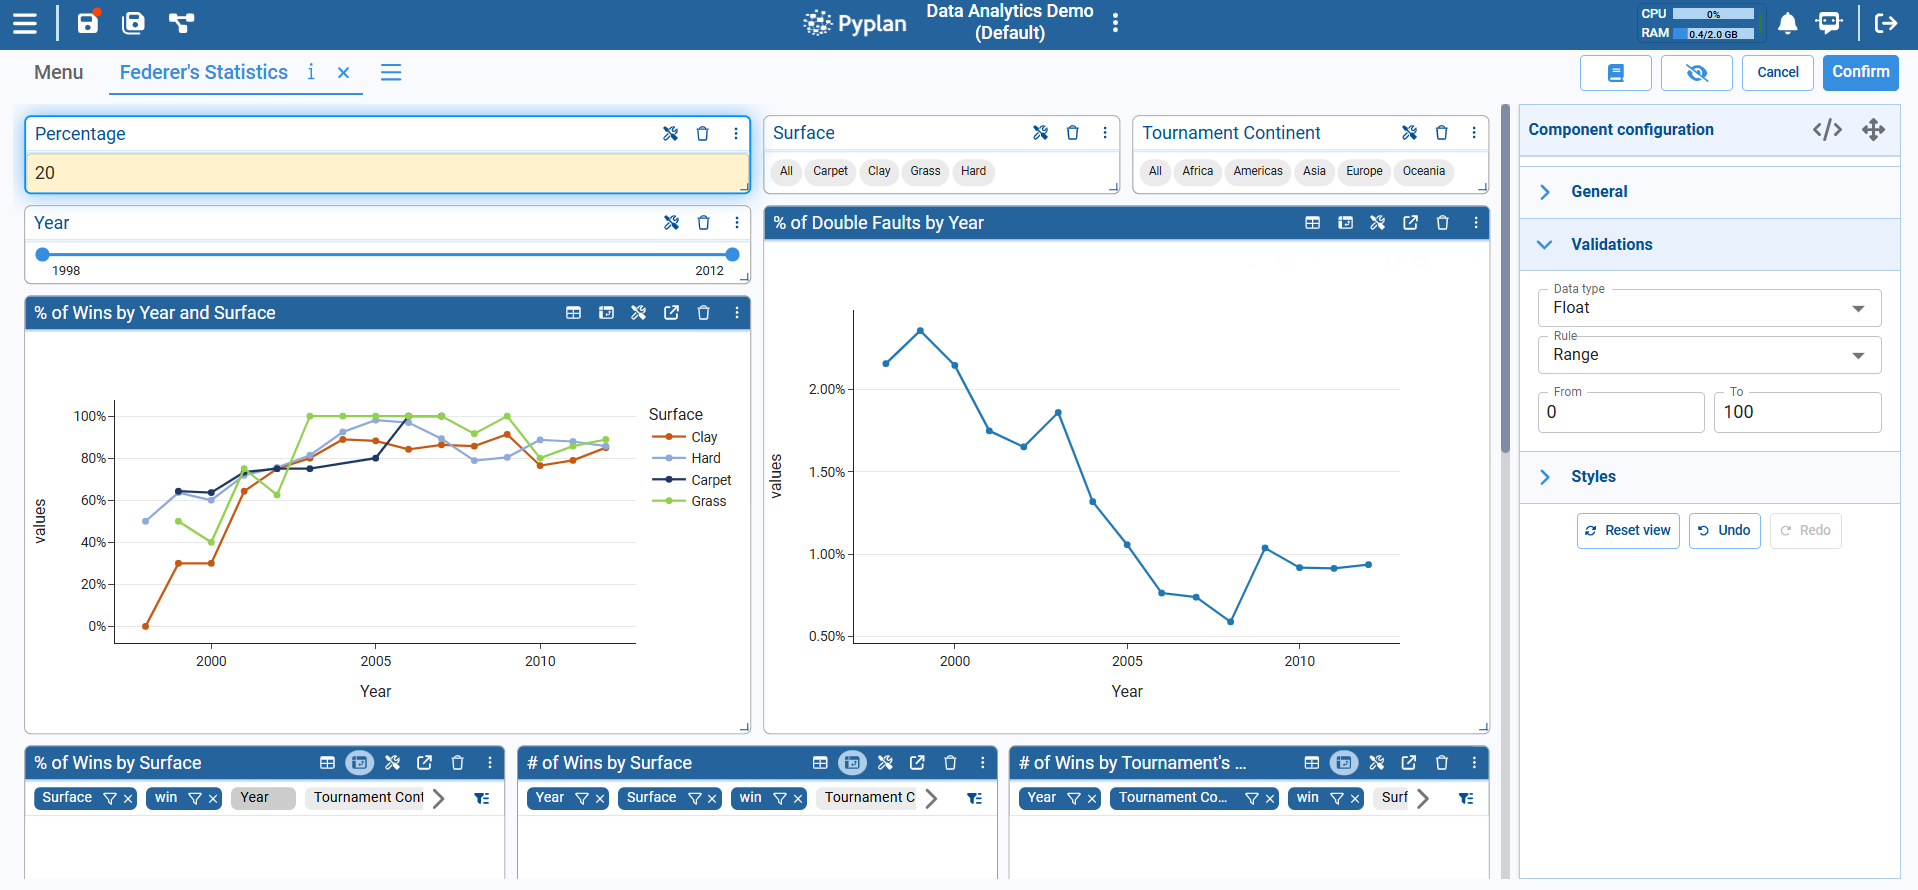
Typically, this component is bound to a node or used as part of a configuration so that changing its value triggers recalculation downstream.
6.2 Manual Data Entry with Forms and Cubes (Conceptual)
For more complex input (tables or multidimensional cubes):
- We define Input data nodes of type:
- Form – tabular input stored in a DB.
- Cube – multidimensional input stored in a DB.
- We then display them through:
- A Table component bound to the form/cube node.
- Or specific input components when configured.
Basic steps (conceptual):
- In the influence diagram, create an Input data node.
- Choose Form or Cube and configure fields/indexes in the wizard.
- In an interface, add a Table component.
- End users can edit the table cells directly.
7. Analyst Agent: Functioning and Context
The Analyst Agent is an AI assistant specialized in interpreting and explaining data. It can:
- Answer natural language questions about the data displayed in the current interface.
- Provide summaries, trends, comparisons, and insights.
- Use context from nodes and the current view.
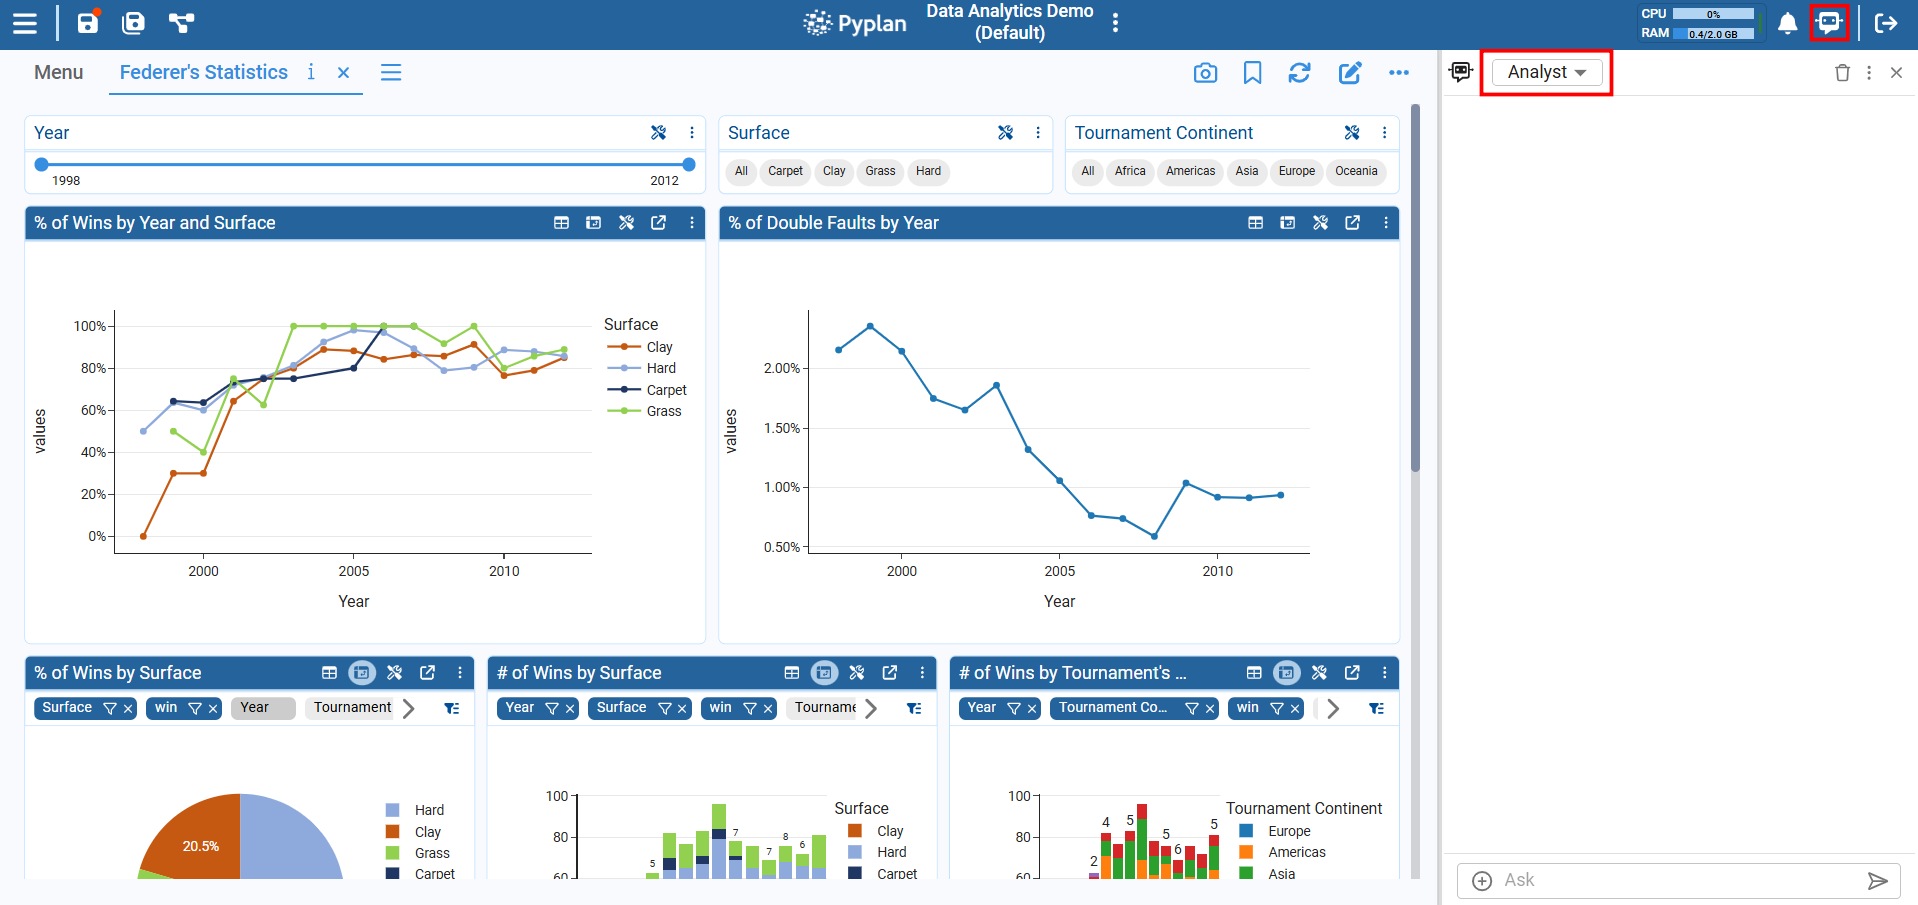
7.1 Opening the Analyst Agent
Step‑by‑step
- While working in an interface, locate the AI / Agent icon in the top bar (usually on the right).
- Click it to open the Agent panel.
- Select the Analyst Agent (if multiple agents are available).
7.2 How the Analyst Agent Uses Context
The Analyst Agent can access:
- Data from the nodes underlying the current components (tables, charts).
- Other contextual nodes configured for the agent.
7.3 Asking Questions to the Analyst Agent
Step‑by‑step example
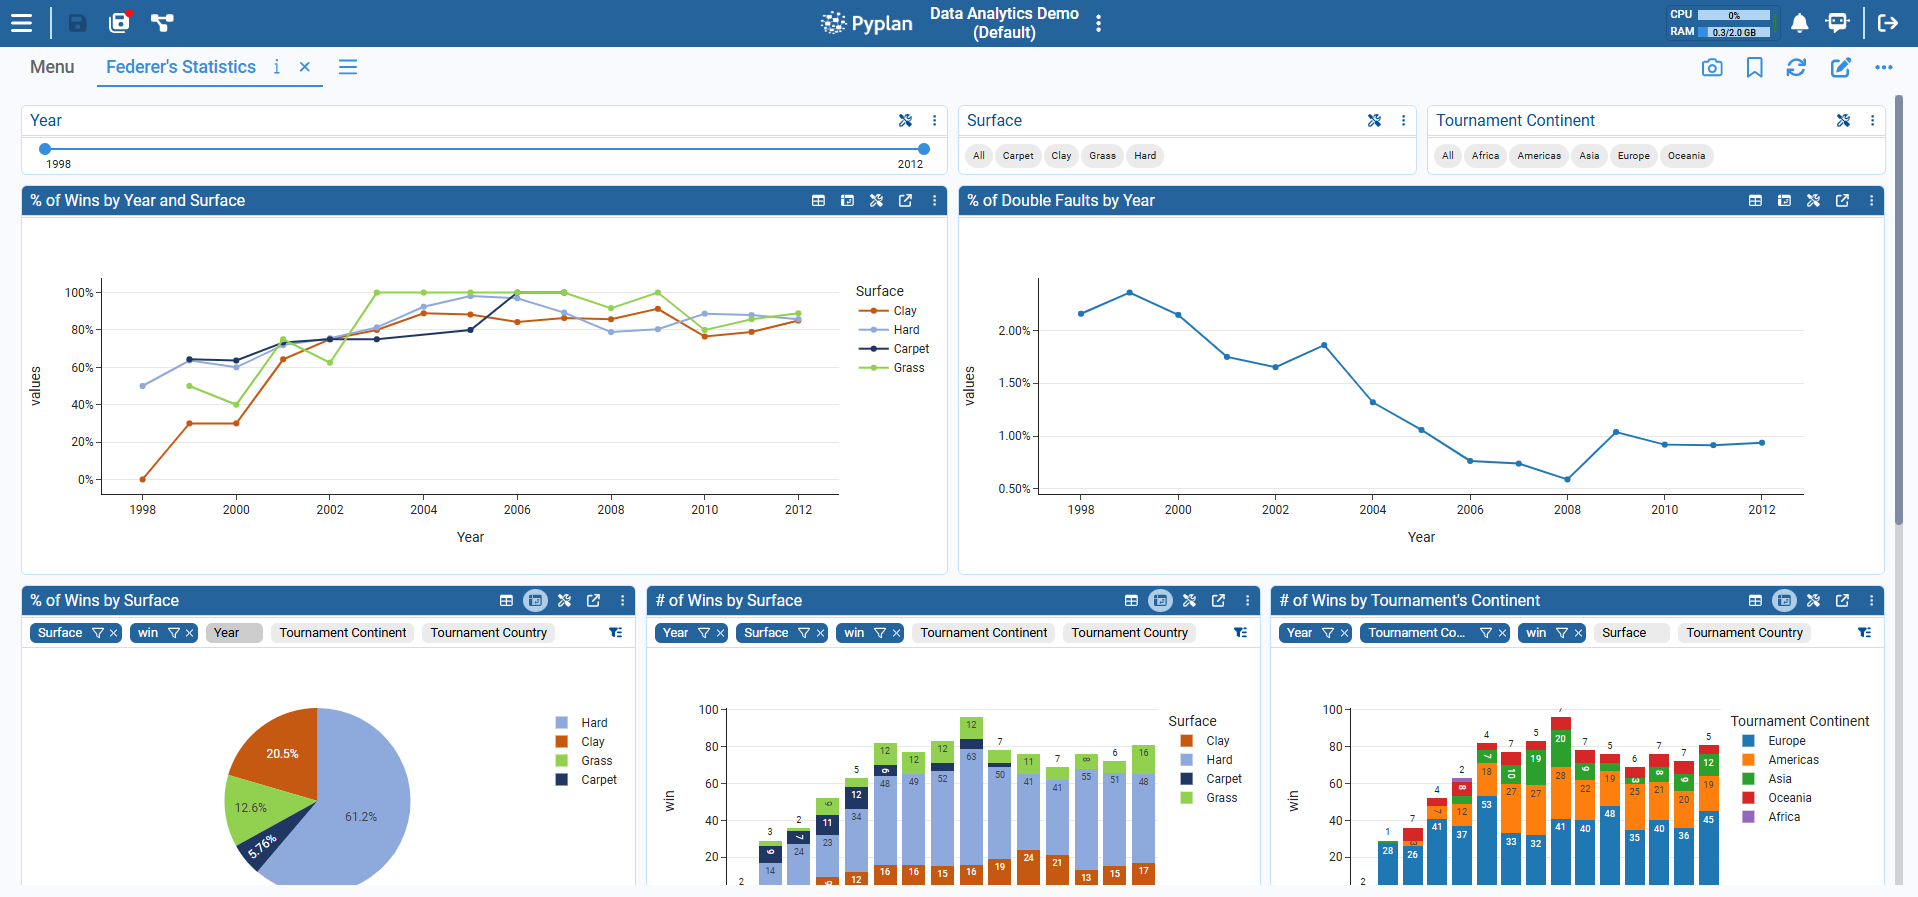
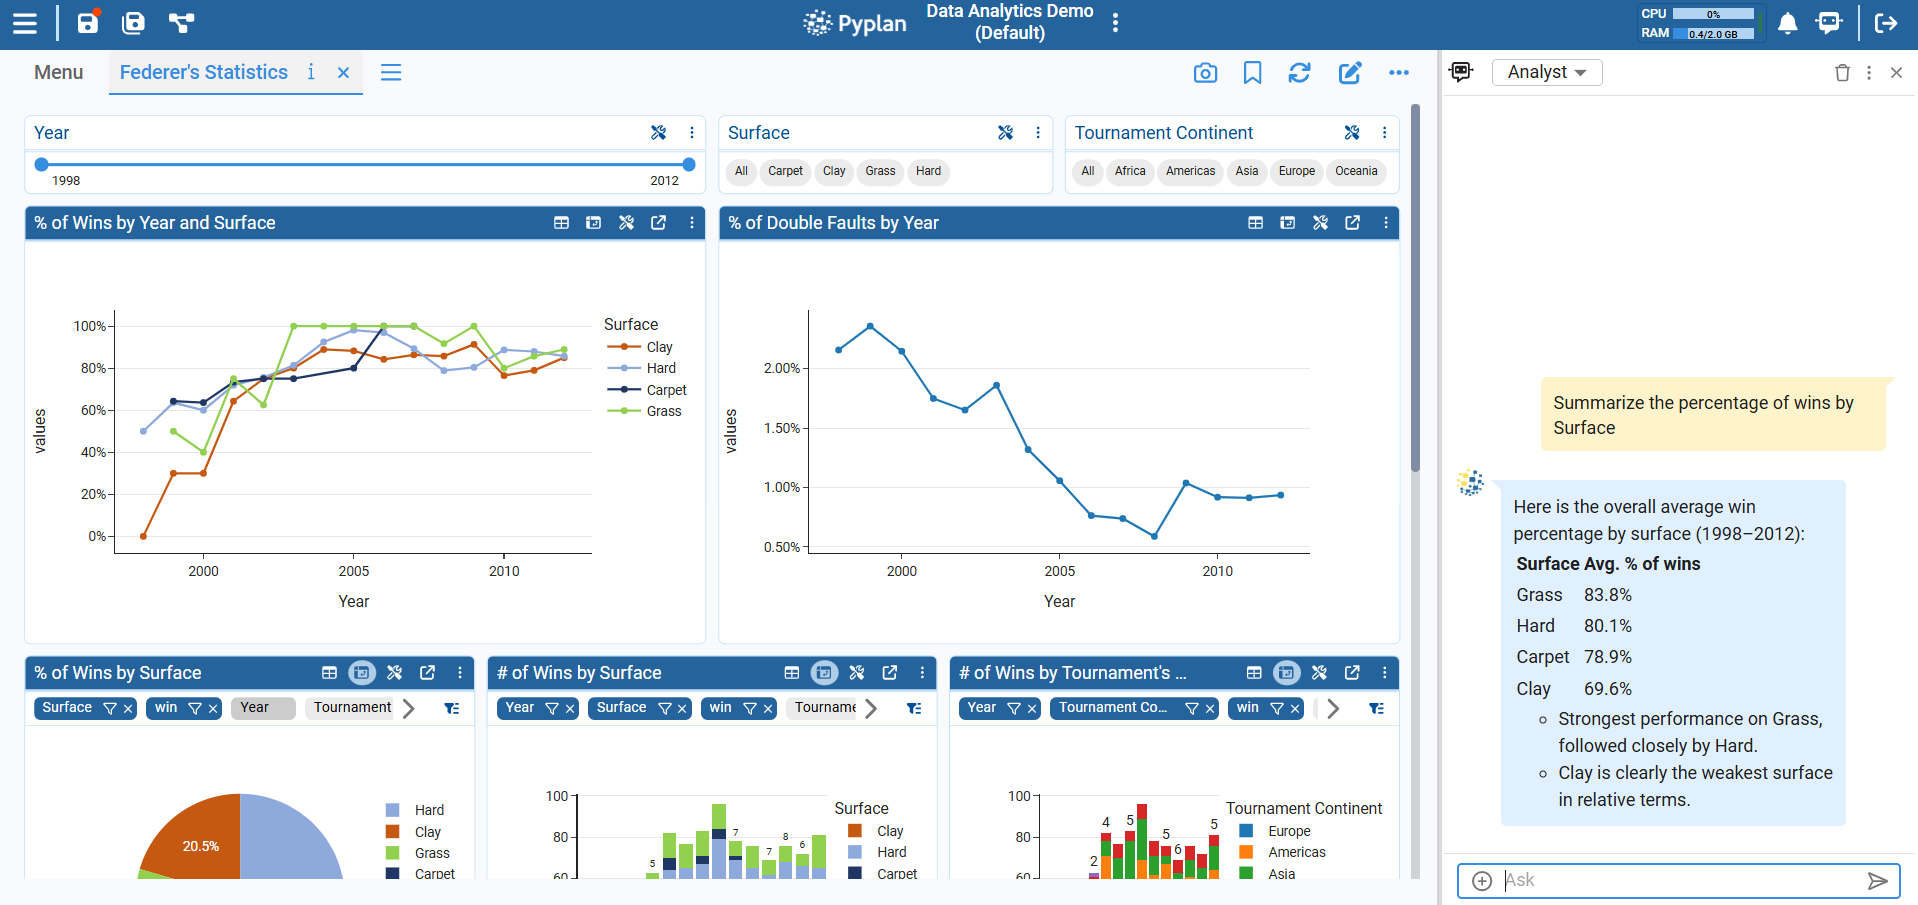
- Go to the Federer's Statistics interface. Ensure the interface displays relevant data.
- Open the Analyst Agent panel.
- In the input box, type:
"Summarize the percentage of wins by Surface"
- Submit the question.
- The agent:
- Reads the contextual data (nodes, filters).
- Performs the required calculations.
- Returns a concise explanation (and sometimes suggestions).
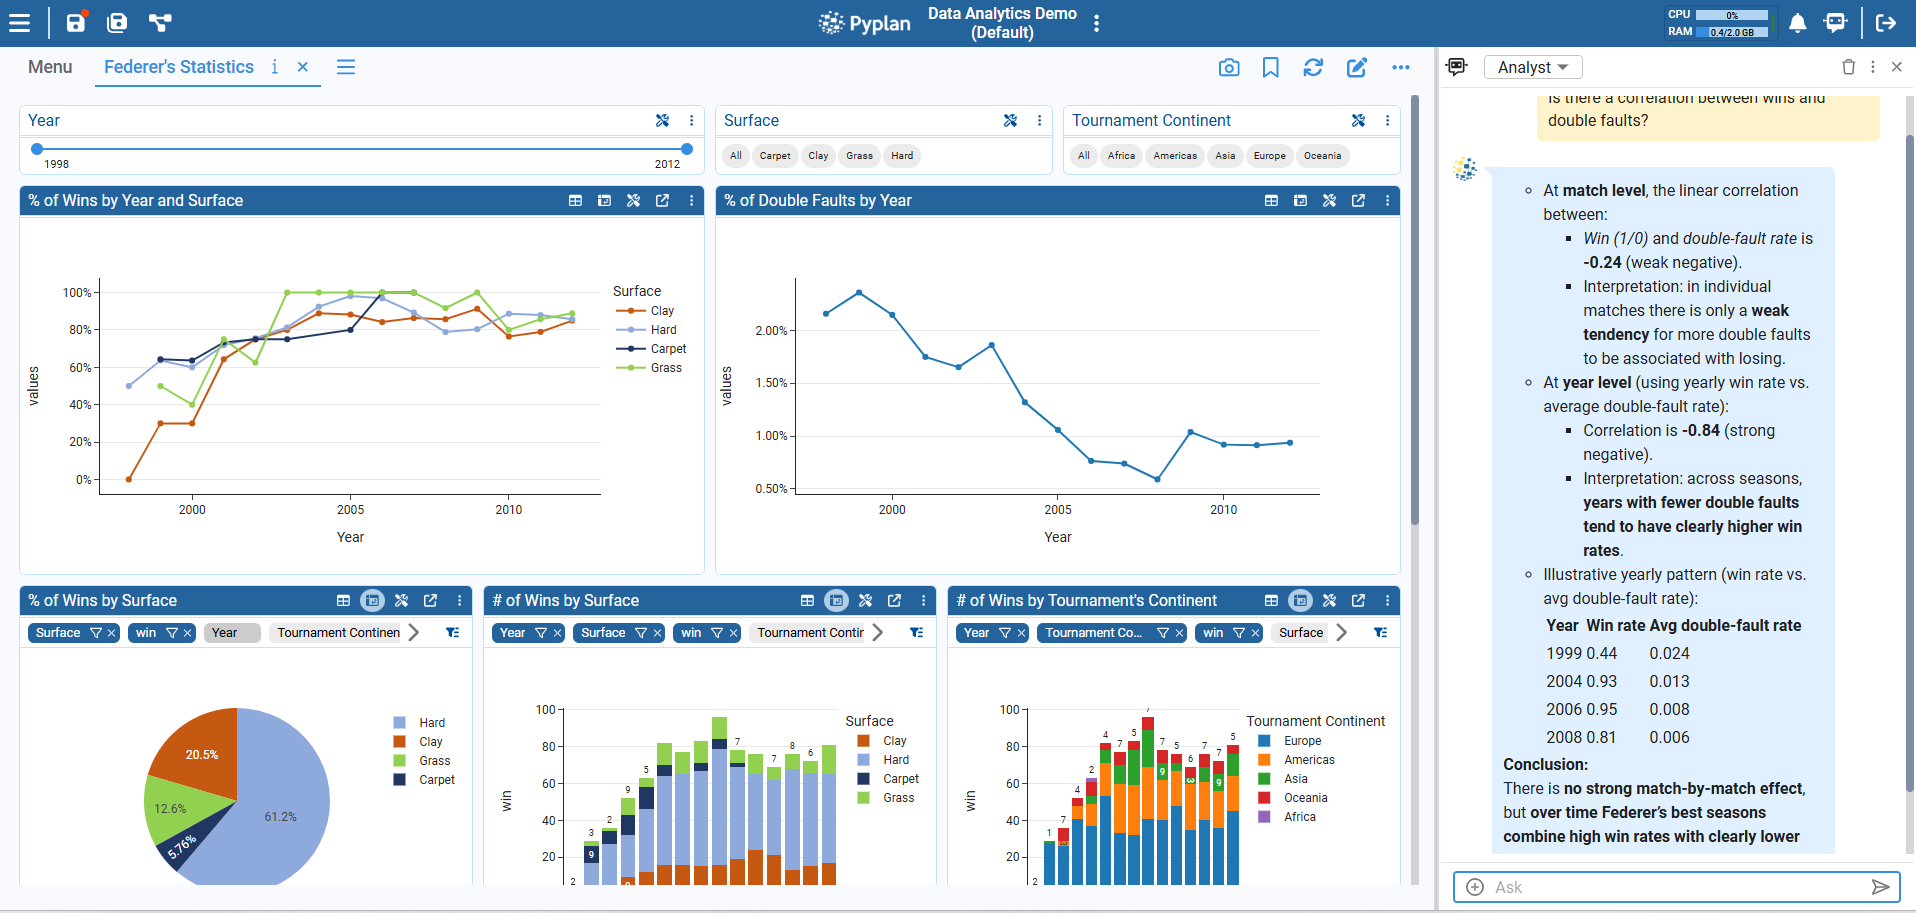
- Optionally refine the question:
- "Which country has more match wins?"
- "Is there a correlation between wins and double faults?"
7.4 Best Practices When Using the Analyst Agent
- Be specific about:
- Time windows (e.g., "last 2 years").
- Dimensions (e.g., "by region and product line").
- Ensure the interface is showing the data you want the agent to focus on.
- Use it to:
- Check intuition ("Is there a seasonality pattern?").
- Generate quick narratives ("Write a summary for management").
8. Suggested Practice Exercise
To consolidate this module, follow this small exercise.
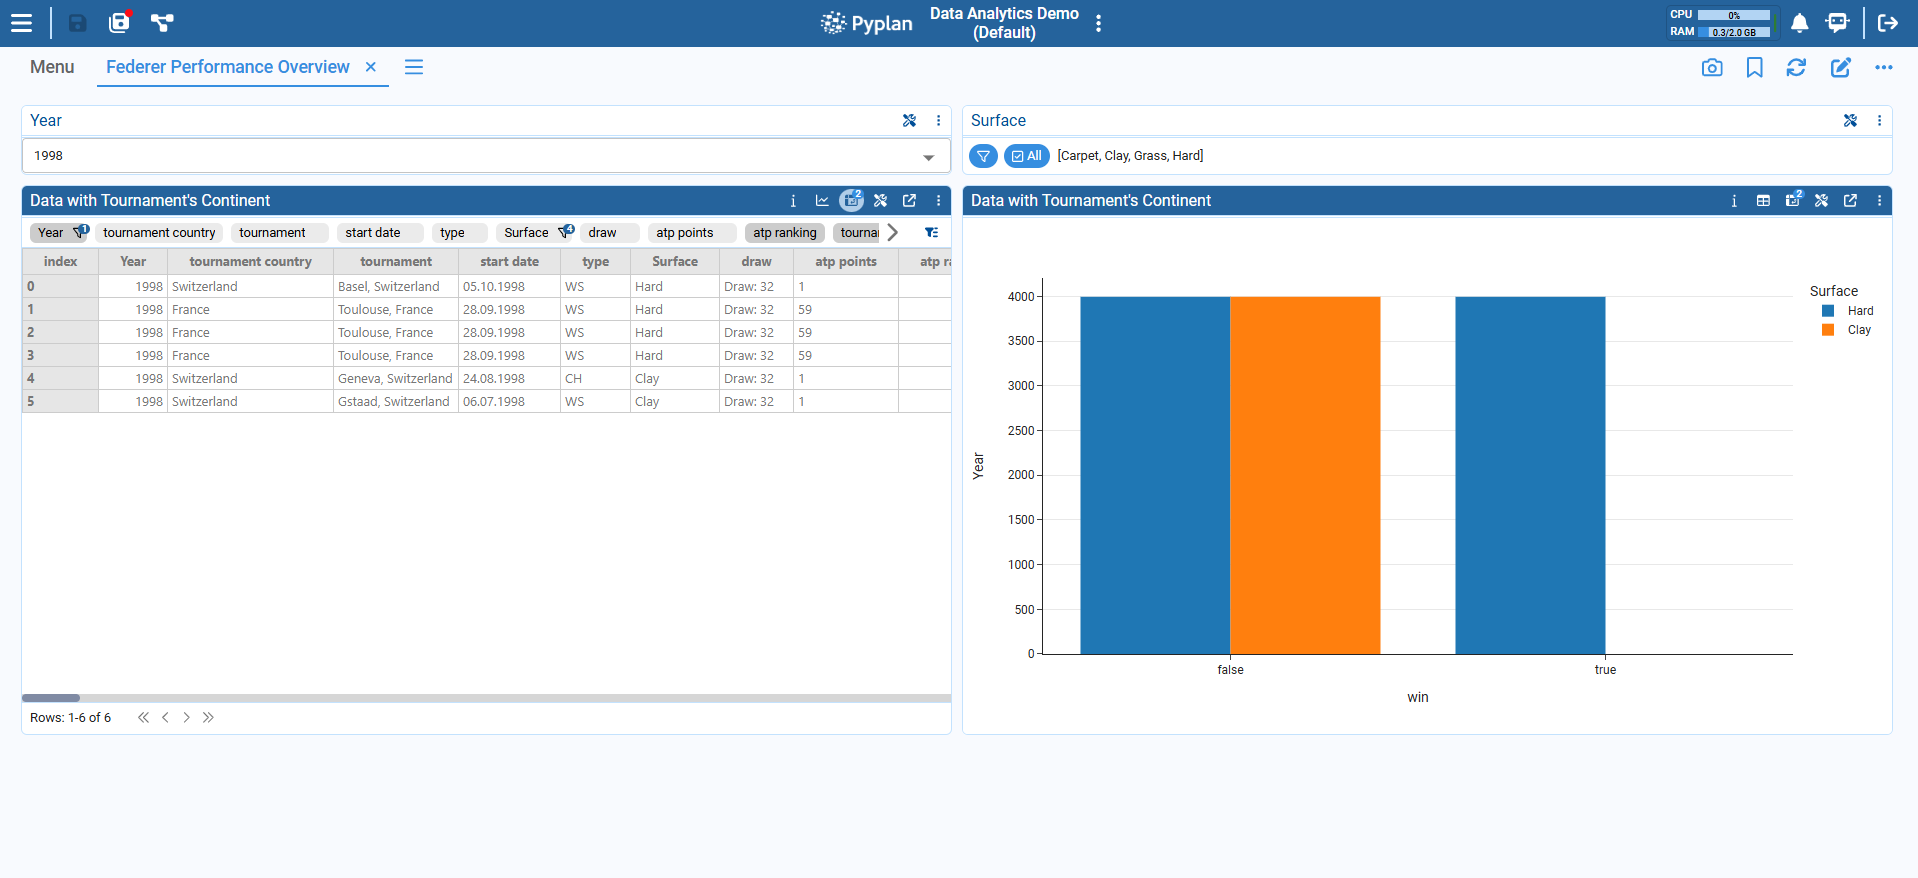
Exercise: Federer Performance Overview
Create a new interface called Federer Performance Overview.
Add the following components:
- A Table component bound to a Roger Federer statistics node (DataFrame or cube), such as match-level or season-level statistics.
- A Chart component (e.g. bar or line) using the same node to visualize performance metrics (e.g. wins, win percentage, aces, or double faults).
Add two Index components:
- Year
- Single select
- Format "Select"
- Surface
- Multi select
- Format "Options list"
(Alternatively, Surface can be replaced with Tournament or Tournament Country)
Configure behavior:
- Configure Index sync on both the table and the chart so they are filtered by Year and Surface.
Final steps:
- Save the interface and exit edit mode.
Use the Analyst Agent:
- Ask: "Explain the differences in Federer's performance across surfaces for the selected year."
- Adjust the filters and ask follow-up questions to compare seasons or surfaces.
Summary
In this tutorial we:
- Defined what an interface is in Pyplan and how it connects to nodes.
- Used the Interface Manager to view, create, edit, duplicate, and manage interfaces.
- Built a simple interface by:
- Adding tables, charts, and indicator components.
- Configuring styles and visualization options.
- Explored indexes in interfaces:
- Index components, hierarchies, and Index sync across components.
- Created simple manual inputs using the Input Data component (and understood forms/cubes conceptually).
- Learned how to work with the Analyst Agent:
- Opening it,
- Asking context‑aware questions about current interface data,
- Interpreting the answers.
With Modules 1 and 2 we now understand both sides of a Pyplan app: the code / influence diagram and the interfaces / user experience, plus how to leverage no‑code tools and AI agents to analyze data effectively.