Logs
The Logs section offers a window into the application's activity timeline. This log captures a series of actions, timestamps, and user details, providing a comprehensive record for users to review and understand the flow of activities. The flexibility to filter logs by date, user, model, instance, and actions ensures a targeted exploration of specific events.
This tool proves invaluable for users seeking transparency and detailed insights into the inner workings of Pyplan.
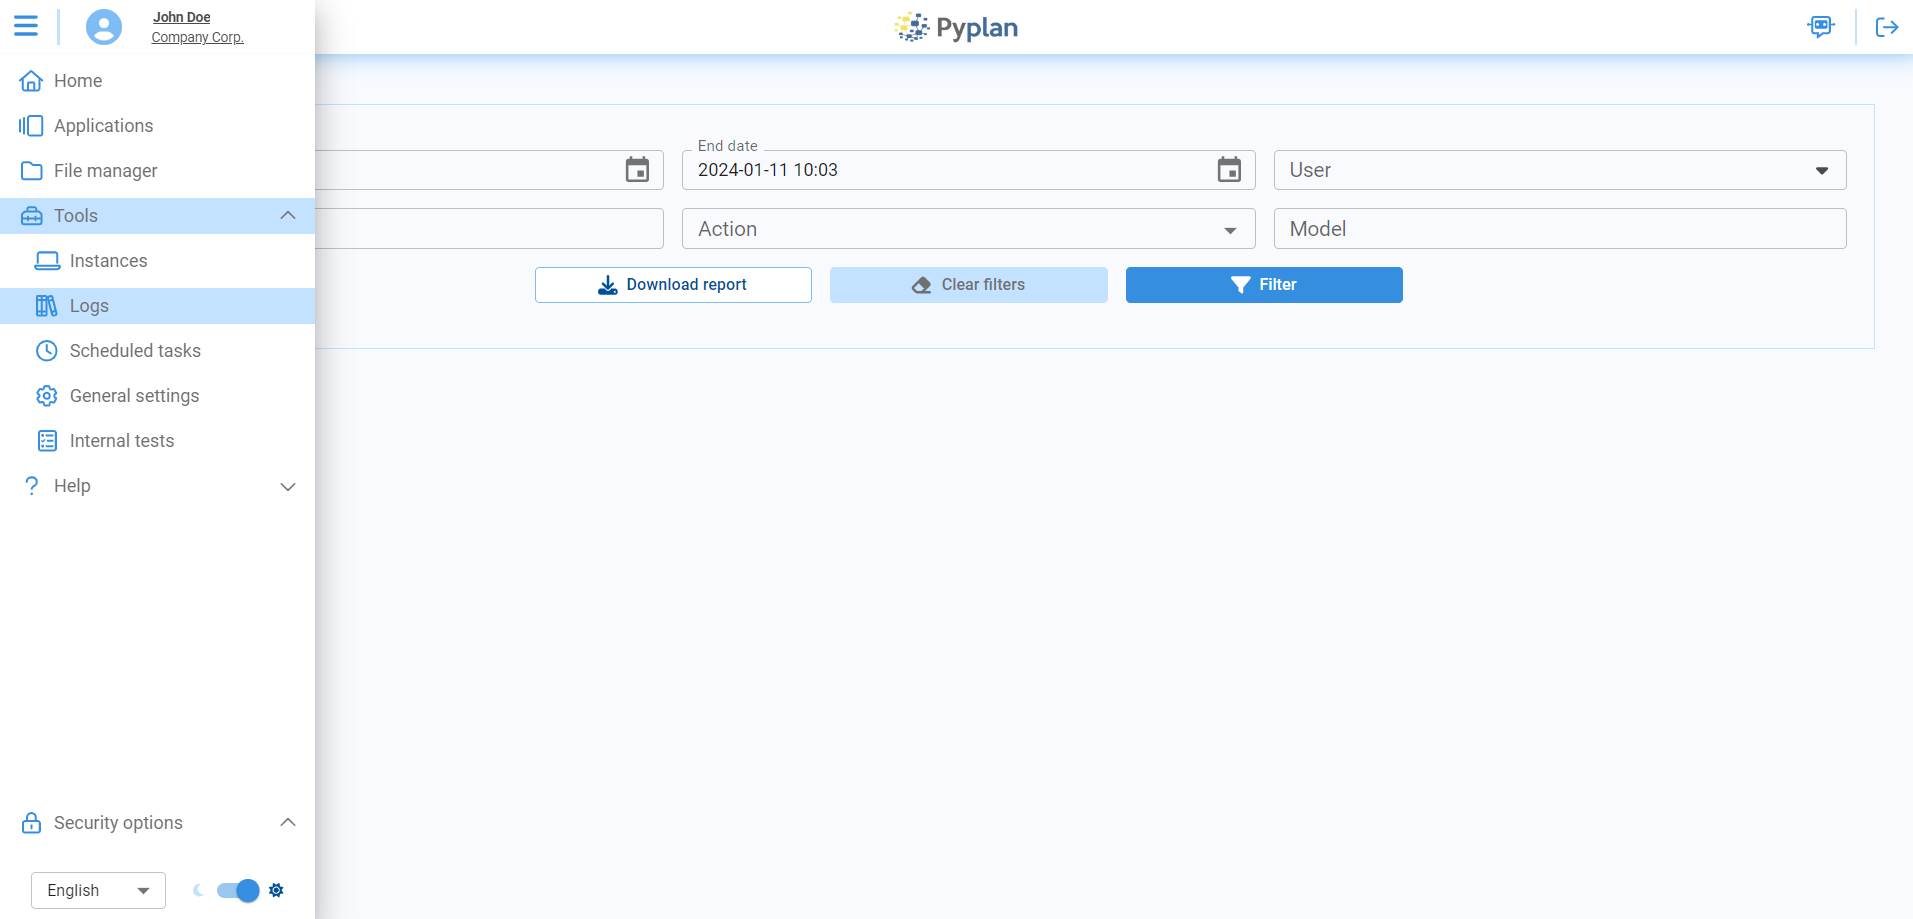
Filtering Logs
Easily explore logs with filters that make it straightforward to find and understand specific log entries:
| Filter | Description |
|---|---|
| Start Date and End Date | Define a specific time frame for log exploration. Maximum range: 7 days. |
| User | Isolate and analyze activities associated with a particular user. |
| Instance | Trace the sequence of events specific to a chosen instance. |
| Action | Refine analysis by selecting a specific action type. |
| Model (App) | Focus on activities related to a specific model or application. |
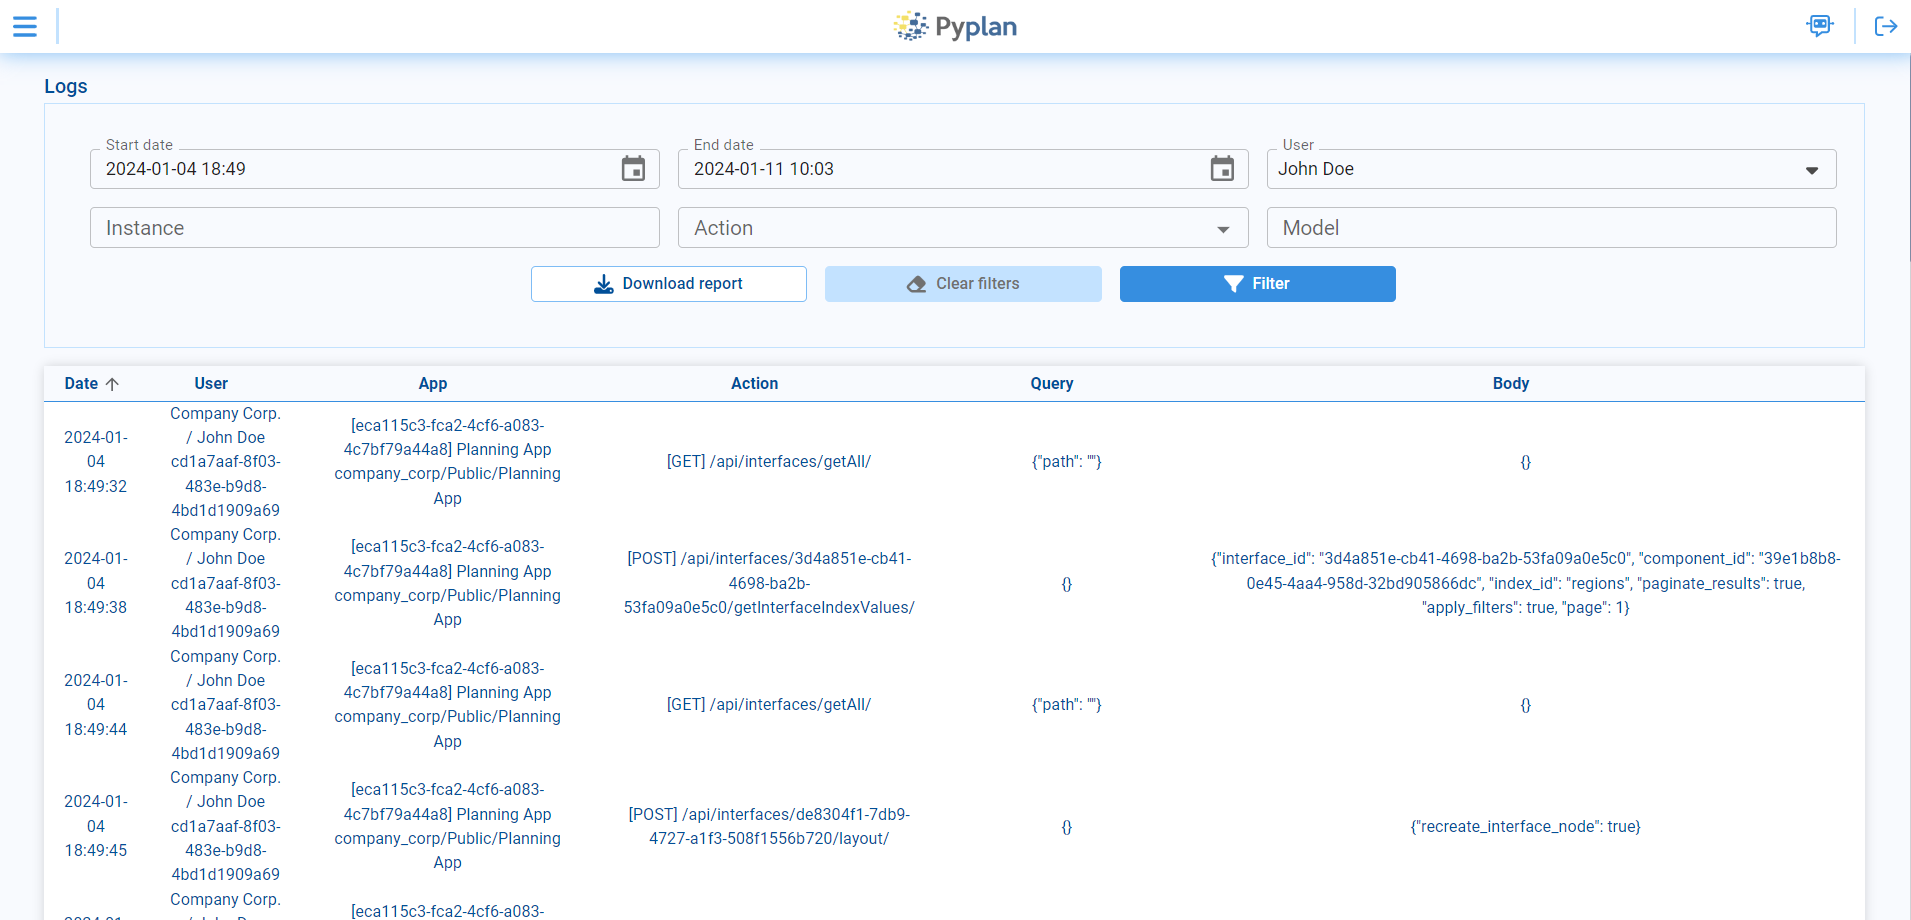
Upon applying filters, each row in the log table signifies a distinct action with the following columns:
| Column | Description |
|---|---|
| Date | Chronological timestamp of each log entry — when the corresponding action occurred. |
| User | The user associated with each log entry. |
| App | The application involved in the logged action. |
| Action | The action taken. |
| Query | Details of the query associated with the log entry, providing transparency into data retrieval or manipulation processes. |
| Body | A snapshot of the content or payload associated with the log entry, providing additional context. |